Download
1 / 26
270 likes | 405 Views
Learn how sample proportions are used to estimate unknown population parameters and why sampling distribution is crucial for accurate statistical analysis. Explore ways to calculate and interpret sample proportions in large populations.

E N D
What do YOU think? 91% of teens have been bullied • Are these parameters or statistics? • What specific type of parameter/statistic are they? • How do you think they were calculated? How can we be sure that method yielded a good estimate? 74% of US teens carry a cell phone 57% of teens credit their cell phone with improving their life 42% of teens can text blindfolded Source: stageoflife.com
Sample Proportions Objective Purpose • To figure out how we determine a proportion of interest in a large population. • So we can gain information about populations even when we can’t survey the entire population.
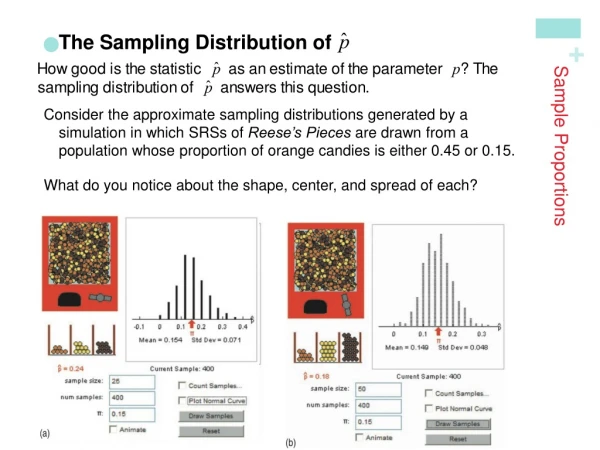
Sampling Distribution of a Sample Proportion • The sample proportion is thestatisticthat we use to gain information about the unknown population parameterp. • How good is the statistic as an estimate of the parameter p? • To find out, we ask, “What would happen if we took many samples?” The samplingdistributionof answers this question.
Sampling Distribution of a Sample Proportion • The sample proportion is thestatisticthat we use to gain information about the unknown population parameterp. • How good is the statistic as an estimate of the parameter p? • To find out, we ask, “What would happen if we took many samples?” The samplingdistributionof answers this question.
Sampling Distribution of a Sample Proportion • The sample proportion is thestatisticthat we use to gain information about the unknown population parameterp. • How good is the statistic as an estimate of the parameter p? • To find out, we ask, “What would happen if we took many samples?” The samplingdistributionof answers this question.
Sampling Distribution of a Sample Proportion • The sample proportion is thestatisticthat we use to gain information about the unknown population parameter p. • How good is the statistic as an estimate of the parameter p? • To find out, we ask, “What would happen if we took many samples?” The samplingdistributionof answers this question.
Sampling Distribution of a Sample Proportion • The sample proportion is thestatisticthat we use to gain information about the unknown population parameter p. • How good is the statistic as an estimate of the parameter p? • To find out, we ask, “What would happen if we took many samples?” The sampling distribution of answers this question.
Sampling Distribution of a Sample Proportion Standard Deviation( ) Mean( ) Values of
Sampling Distribution of a Sample Proportion StandardDeviation ( ) Mean( ) Values of
Sampling Distribution of a Sample Proportion Standard Deviation ( ) Mean ( ) Values of
Sampling Distribution of a Sample Proportion Toolbox Mean Chapter 7: If then Chapter 8: = count of “successes” in sample size of sample in ghosts. Ex: Do You Believe in Ghosts? 160 / 515 = 0.31 said yes!
Sampling Distributionof a Sample Proportion Toolbox Standard Deviation Chapter 7: If then Chapter 8:
In English, Please! • The mean of the sampling distribution of a sample proportion is exactly p. • The standard deviation of the sampling distribution of a sample proportion is
So What? • The sample proportionis an unbiasedestimator of p! • The standard deviation of gets smaller as the sample size n increases. • That is, is less variablein larger samples.
So What? • The sample proportionis an unbiased estimator of p! • The standard deviation of gets smaller as the sample size n increases. • That is, is less variablein larger samples.
So What? • The sample proportionis an unbiased estimator of p! • The standard deviation of gets smaller as the sample size n increases. • That is, is less variable in larger samples.
So What? • The sample proportionis an unbiased estimator of p! • The standard deviation of gets smaller as the sample size n increases. • That is, is less variable in larger samples.
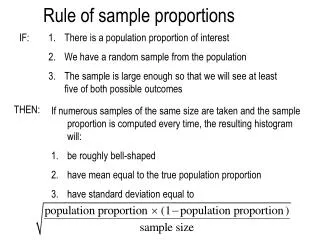
Warning! • The formula for the standard deviation of doesn’t apply when the sample is a large part of the population. (In that case we could just examine the entire population!) Rule of Thumb 1: Use the formula for the standard deviation of only when the population is at least 10 times as large as the sample.
Using the Normal Approximation • The sampling distribution of is approximately normal • The larger the sample size n, the closer the sampling distribution is to a normal distribution Rule of Thumb 2: We will use the normal approximation to the sampling distribution of for values of n and p that satisfy np ≥ 10 and n(1-p) ≥ 10.
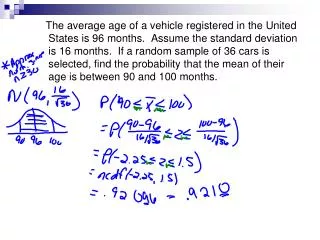
Example: Do You Jog? (Homework Problem #25) The Gallup Poll once asked a random sample of 1540 adults, “Do you happen to jog?” Suppose that in fact 15% of all adults jog. • Find the mean and standard deviation of the proportion of the sample who jog. (Assume the sample is an SRS.) • Explain why you can use the formula for the standard deviation of in this setting. • Check that you can use the normal approximation for the distribution of . • Find the probability that between 13% and 17% of the sample jog. • What sample size would be required to reduce the standard deviation of the sample proportion to one-third the value you found in (a)?
Example: Rules of Thumb(Homework Problem #30) Explain why you cannot use the methods of this section to find the following probabilities. • A factory employs 3000 unionized workers, of whom 30% are Hispanic. The 15-member union executive committee contains 3 Hispanics. What would be the probability of 3 or fewer Hispanics if the executive committee were chosen at random from all the workers? • A university is concerned about the academic standing of its intercollegiate athletes. A study committee chooses an SRS of 50 of the 316 athletes to interview in detail. Suppose that in fact 40% of the athletes have been told by coaches to neglect their studies on at least one occasion. What is the probability that at least 15 in the sample are among this group? • Use what you learned in Chapter 8 to find the probability described in part (a).
Reese’s Pieces Activity! Learning Goal: • To understand the effect of sample size on the sampling distribution. • www.Rossmanchance.com/applets/Reeses/ReesesPieces.html
Closing Summary • Today we continued learning about sampling distributions. • We looked at one particular type of sampling distribution – the sampling distribution of the sampling proportion. • We learned that as long as the population (Rule of Thumb 1) and sample size (Rule of Thumb 2) are large enough, the sampling distribution is approximately normal with mean p and standard deviation
Exit Ticket • Suppose I want to know what proportion of U.S. teenagers play a sport. How could I come up with an answer to my question? Why does that method work? How could I improve my results?
Example: Applying to College • A polling organization asks an SRS of 1500 first-year college students whether they applied for admission to any other college. In fact, 35% of all first-year students applied to colleges besides the one they are attending. What is the probability that the random sample of 1500 students will give a result within 2 percentage points of this true value? • What are we given? • What are we looking for? • What does our sampling distribution look like? • Is our population at least 10 times the size of our sample? • Can we use the normal approximation?