Download
1 / 24
240 likes | 388 Views
Global Climate Change. The Greenhouse Effect. Some of the infrared radiation passes through the atmosphere, and some is absorbed and re-emitted in all directions by greenhouse gas molecules. The effect of this is to warm the Earth’s surface and the lower atmosphere.

E N D
The Greenhouse Effect Some of the infrared radiation passes through the atmosphere, and some is absorbed and re-emitted in all directions by greenhouse gas molecules. The effect of this is to warm the Earth’s surface and the lower atmosphere. Some solar radiation is reflected by the Earth and the atmosphere Solar radiation passes through the clear atmosphere Infrared radiation is emitted from the Earth’s Surface Most radiation is absorbed by the Earth’s surface and warms it
Greenhouse Gases (GHG) Carbon dioxide* Methane* - CH4 Nitrous oxide* - N2O CFCs – chlorofluorocarbons** Water vapor *These are increasing due to human activities, primarily burning of fossil fuels ** Being phased out, but persist in the atmosphere for decades
2 – SO4 NO3 – Primary Pollutants CO CO2 Secondary Pollutants SO2 NO NO2 SO3 Most hydrocarbons HNO3 H2SO4 Most suspended particles H2O2 O3 PANs Most and salts Sources Natural Stationary Mobile
Examples of Greenhouse Gases Affected by Human Activities CO2 CH4 N2O Pre-industrial concentration 288 ppmv 848 ppbv 285 ppbv Concentration in 1999 366 ppmv 1800 ppbv 312 ppbv 100 year Global Warming Potential 1 21 310 Atmospheric lifetime (years) 50-200a 12b 120 ppmv = part per million volume; ppbv = part per billion volume a No single lifetime for CO2 can be defined because of the different rates of uptake by different processes. b Defined as an adjustment time which takes into account the indirect effects of methane on its own lifetime. Sources: IPCC 1995, CDIAC (Manua Loa, Siple Station, Law Dome “DE08”, AGAGE, and Law Dome “BHD” data)
Atmospheric carbon dioxide does vary over time -Graph below shows earth’s atmospheric CO2 levels back 400,000 years before present based on ice core data
380 380 360 360 340 CO2 Concentration (ppmv) 340 320 300 CO2 Concentration (ppmv) 320 280 1850 1900 1950 2000 300 280 260 800 1000 1200 1400 1600 1800 2000 Year CO2 Concentrations Over the Past 1000 Years Source: Based on IPCC (1994)
Atmospheric carbon dioxide levels 1960-2000 Graph interpretation: • What is happening to the level of carbon dioxide in the atmosphere? • What accounts for the rise and fall within each year?
Current levels of atmospheric CO2 January 2011: 391ppm “Safe” level is 350ppm or less Has been over 350 since 1988 http://co2now.org/
Global Warming? • This graph shows annual mean global temperature anomalies over the period 1880-2001. The zero line represents the long term mean temperature from 1880-2001, and the red and blue bars are showing annual departures from that mean. As is evident in the graph, 2001 was second only to 1998 in terms of global temperature, and the trend has been toward increasing temperatures at least since the beginning of the 20th century. Land temperatures have greater anomalies than the ocean, which is to be expected since land heats up and cools down faster than water.
Consequences of global warming • Rising sea levels – due to (1) melting of glaciers and polar ice (documented already) (2) thermal expansion of ocean at warmer temps How will this affect polar regions? Islands? Coastal cities?
2. Human health problems • More problems with mosquitoes, diseases they transmit • Ground-level ozone increases, leading to breathing problems
HEALTH EFFECTS OF CLIMATE CHANGE Heat Stress Cardiorespiratory failure Respiratory diseases, e.g., COPD & Asthma Malaria Dengue Encephalitis Hantavirus Rift Valley Fever Cholera Cyclospora Cryptosporidiosis Campylobacter Leptospirosis Malnutrition Diarrhea Toxic Red Tides Forced Migration Overcrowding Infectious diseases Human Conflicts Urban Heat Island Effect Air Pollution Vector-borne Diseases Water-borne Diseases Water resources & food supply Environmental Refugees CLIMATE CHANGE Temperature Rise 1 (Sea level Rise 2) Hydrologic Extremes 12°C by yr. 2100 249 cm“ “ IPCC estimates Source: Jonathan Patz, 1998
Consequences of global warming 3. Changes in weather patterns, such as more severe storms, changes in precipitation The frequency of downpours and heat waves, as well as the power of hurricanes, has increased so dramatically that "100-year storms" are striking some areas once every 15 years
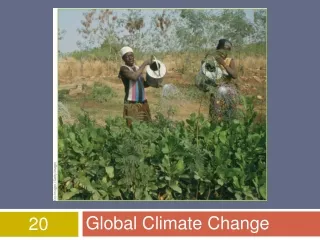
Consequences of global warming 4. Agriculture Decrease in crop yield due to drought, floods Increased need for irrigation
Consequences of global warming 5. Effects on plants and animals Organisms in ecosystems are adapted for certain climate and if that changes, plants and animals there may not survive (adaptation in plants and animals takes time and global warming is changing things quickly), ex: polar bear Models predicting future status of polar bears are debated (models are, by nature, complex)
Present Range Overlap Predicted Range Current and Projected Ranges of Sugar Maple Prediction based on increased temperature Prediction based on increased temperature and moisture reduction Source: Redrawn from Davis and Zabinski, 1992
Debate over global warming? IPCC – • Intergovernmental Panel on Climate Change • Established to be an objective source of information on climate change for policy makers worldwide • made conclusions based on many scientific studies • concluded with statistical certainty (90%) that human activity is contributing to global warming, 2007 See their report: http://www.ipcc.ch/pdf/assessment-report/ar4/syr/ar4_syr.pdf
Nobel Peace Prize Nobel Peace Prize was awarded in 2007 to Al Gore, former Vice President of U.S., and the IPCC for work on the issue of climate change What does global warming have to do with world peace?
Kyoto Protocol, 1997 International agreement to reduce greenhouse gas emissions About 120 countries agreed, U.S. has not U.S. objections: negative economic impacts, developing countries not held to same protocol as developed countries (not seen as fair) Expires in 2012
Copenhagen Accord, 2009 U.N. sponsors a yearly meeting of many of the world’s countries to discuss global climate change Recent outcome: Copenhagen Accord – non-binding agreement to combat climate change Some of the main points: • Recognizes the scientific view that an increase of 2°C should be the limit in order to combat climate change • Countries set goals to reduce GHG emissions • Reduction in deforestation is critical • Endorsed continuation of Kyoto Protocol • Funding/incentives should be provided to developing countries
Copenhagen Accord, 2009 Criticism • Not a legal agreement • Was drafted by only 5 countries • Does not say where funding will come from • Sets no real targets for emissions reductions • Countries only “took note” of the accord, did not adopt it