Download

1 / 36
380 likes | 575 Views
Working With Financial Statements. Chapter 3. Prepare for Capital Budgeting. Part 2: Understand financial statement and cash flow C2-Identify cash flow from financial statement C3-Financial statement and comparison Part 3: Valuation of future cash flow C4-Basic concepts

E N D
Working With Financial Statements Chapter 3
Prepare for Capital Budgeting Part 2: Understand financial statement and cash flow C2-Identify cash flow from financial statement C3-Financial statement and comparison Part 3: Valuation of future cash flow C4-Basic concepts C5-More exercise Part 4: Valuing stocks and bonds C6-Bond C7-Stock Part 5: Capital budgeting
Chapter Outline • Why Evaluate Financial Statements? • Categories of Financial Ratios • Du Pont Identity • Payout and Retention Ratios • Problems with Financial Statement
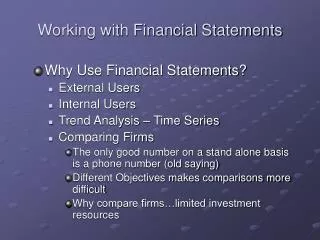
1.Why Evaluate Financial Statements? • Internal uses • Planning for the future – estimating future cash flows • Performance evaluation – improving problematic operation and adjusting forecasting target • External uses • Creditors, Stockholders • Suppliers, Customers
Benchmarking • Ratios are not very helpful by themselves; they need to be compared to something • Time-Trend Analysis • Used to see how the firm’s performance is changing through time • Peer Group Analysis • Compare to similar companies or within industries • SIC (Standard Industrial Classification) and NAICS (North American Industry Classification System) codes
Standardized Financial Statements • Common-Size Balance Sheets • Compute all accounts as a percent of total assets • Common-Size Income Statements • Compute all line items as a percent of sales • Standardized statements make it easier to compare financial information, particularly as the company grows • They are also useful for comparing companies of different sizes, particularly within the same industry
Ratio Analysis • Ratios also allow for better comparison through time or between companies • As we look at each ratio, ask yourself what the ratio is trying to measure and why is that information important • Ratios are used both internally and externally
2.Categories of Financial Ratios • Short-term solvency or liquidity ratios • Long-term solvency or financial leverage ratios • Asset management or turnover ratios • Profitability ratios • Market value ratios
Sample Balance Sheet Numbers in thousands
Sample Income Statement Numbers in thousands, except EPS & DPS
Short-term Solvency Measures:Liquidity Ratios Evaluate the firm’s ability to pay its bills over the short run without undue stress. • Current Ratio = CA / CL • 1,553,725 / 1,525,453 = 1.02 times • Quick Ratio = (CA – Inventory) / CL • (1,553,725 – 295,225) / 1,525,453 = .825 times • Cash Ratio = Cash / CL • 6,489 / 1,525,453 = .004 times
Long-term Solvency Measures Evaluate the firm’s ability to meet Long-term obligations.
Long-term Solvency Measures-1: Leverage Ratios • Total Debt Ratio = (TA – TE) / TA = TD/TA • (4,088,797 – 1,691,493) / 4,088,797 = .5863 times or 58.63% • The firm finances almost 59% of their assets with debt. • Debt/Equity = TD / TE • (4,088,797 – 1,691,493) / 1, 691,493 = 1.417 times • Equity Multiplier (EM) = TA / TE = 1 + D/E • 1 + 1.417 = 2.417
Long-term Solvency Measures-2: Coverage Ratios • Times Interest Earned = EBIT / Interest • 739,987 / 42,013 = 17.6 times • Cash Coverage = (EBIT + Depreciation) / Interest • (739,987 + 308,355) / 42,013 = 24.95 times
Asset Management Measures Evaluate how efficiently the firm uses its asset to generate sales.
Asset Management Measures-1:Inventory Ratios • Inventory Turnover = Cost of Goods Sold / Inventory • 1,738,125 / 295,255 = 5.89 times • Days’ Sales in Inventory = 365 / Inventory Turnover • 365 / 5.89 = 62 days
Asset Management Measures-2: Receivables Ratios • Receivables Turnover = Sales / Accounts Receivable • 3,991,997 / 1,052,606 = 3.79 times • Days’ Sales in Receivables = 365 / Receivables Turnover • 365 / 3.79 = 96 days
Asset Management Measures-3:Total Asset Turnover • Total Asset Turnover (TAT) = Sales / Total Assets • 3,991,997 / 4,088,797 = .98 times • Measure of asset use efficiency • Not unusual for TAT < 1, especially if a firm has a large amount of fixed assets
Profitability Measures:Profitability Ratios Evaluate the operation efficiency of the firm. • Profit Margin (PM) = Net Income / Sales • 425,764 / 3,991,997 = .1067 times or 10.67% • Return on Assets (ROA) = Net Income / Total Assets • 425,764 / 4,088,797 = .1041 times or 10.41% • Return on Equity (ROE) = Net Income / Total Equity • 425,764 / 1,691,493 = .2517 times or 25.17%
Market Value Measures:Market Value Ratios Illustrate the difference between market and book value of the firm. • Market Price = $61.625 per share • Shares outstanding = 205,838,594 • PE Ratio = Price per share / Earnings per share • 61.625 / 2.17 = 28.4 times • Market-to-book ratio = market value per share / book value per share • 61.625 / (1,691,493,000 / 205,838,594) = 7.5 times
Deriving the Du Pont Identity • ROE = NI / TE • Multiply by 1 and then rearrange • ROE = (NI / TE) (TA / TA) • ROE = (NI / TA) (TA / TE) = ROA * EM • Multiply by 1 again and then rearrange • ROE = (NI / TA) (TA / TE) (Sales / Sales) • ROE = (NI / Sales) (Sales / TA) (TA / TE) • ROE = PM * TAT * EM
Using the Du Pont Identity • ROE = PM * TAT * EM • Profit margin is a measure of the firm’s operating efficiency – how well does it control costs • Total asset turnover is a measure of the firm’s asset use efficiency – how well does it manage its assets • Equity multiplier is a measure of the firm’s financial leverage
4.Payout and Retention Ratios • Dividend payout ratio = Cash dividends / Net income • 0.86 / 2.17 = .3963 or 39.63% • Retention ratio = Additions to retained earnings / Net income = 1 – payout ratio = b • 1.31 / 2.17 = .6037 = 60.37% • Or 1 - .3963 = .6037 = 60.37%
The Internal Growth Rate • The internal growth rate tells us how much the firm can grow assets using retained earnings as the only source of financing.
The Sustainable Growth Rate • The sustainable growth rate tells us how much the firm can grow by using internally generated funds and issuing debt to maintain a constant debt ratio.
Determinants of Growth • Profit margin – operating efficiency • Total asset turnover – asset use efficiency • Financial leverage – choice of optimal debt ratio • Dividend policy – choice of how much to pay to shareholders versus reinvesting in the firm
5.Problems with Financial Statement • Little financial theory and economic logic exists with financial statements • Limits in comparability 1. Diversified business in conglomerates 2. Different accounting standards across nation 3. Different corporate structure
Review Questions • How do you standardize balance sheets and income statements and why is standardization useful? • What are the major categories of ratios and what does each category of ratios measure? How to interpret each ratio? • What is Du Pont Identity and what are the components of Du Pont Identity? • How is retention ratio?What are the major determinants of a firm’s internal and sustainable growth potential? • What are some of the problems associated with financial statement analysis?
Sample Question 1 Which of the following would decrease the financial leverage of a firm • Total assets increase and the debt to equity ratio remains constant • Total debt increases and total assets remain constant • Net new equity is issued and existing bonds are paid off • Net new bonds are sold and short-term notes payable are paid off
Sample Question 2 • If a firm has a total debt ratio of 0.5, what is its equity multiplier?
Sample Question 3 • Given ROE = 25%, D/E = 1.25, and assets = $600 calculate sales.