Download
1 / 34

E N D
1. Do Non-Institutional Long-Term Care Services Reduce Medicaid Spending? Steve Kaye
Mitch LaPlante
Charlene Harrington
3. PAS Center research on HCBS costs HCBS saves money�
Kitchener, M., Ng, T., Miller, N., & Harrington, C. (2006). Institutional and community-based long-term care: a comparative estimate of public costs. J Health Soc Policy, 22(2), 31-50.
Adding up all public expenditures, HCBS saves $44,000 per participant (2002 $) compared to institutional care.
5. PAS Center research on HCBS costs HCBS doesn�t cost much�
LaPlante, M. P., Kaye, H. S., & Harrington, C. (2007). Estimating the expense of a mandatory home- and community-based personal assistance services benefit under Medicaid. J Aging Soc Policy, 19(3), 47-64.
Community Choice Act (aka MiCASSA) would cost $1.4�3.7 billion/year, not the $13�25 billion of CBO estimate, minus any cost savings.
6. Reaction: That�s nice, but� Individual cost savings don�t necessarily mean program savings
How big is the �woodwork effect�?
Not enough to show that a program is affordable
Need to show cost neutrality or savings
We wondered: Have states with thriving HCBS programs controlled total LTC costs better than other states?
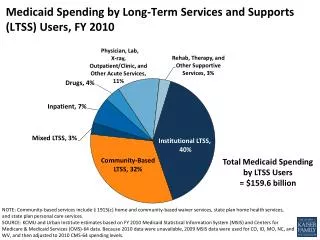
7. Our approach Examine annual state Medicaid expenditures for nursing homes, ICF/MR, home health, personal care plan, and HCBS waivers
Source: CMS 64 & 372 reports from Burwell et al.
Separate costs for people with intellectual & developmental disabilities from other disabilities
Combine states with similar spending patterns and examine trends over a decade
Analysis details: See the Health Affairs article.
12. Percent of Non-MR/DD LTC expenditures spent on HCBS, 2005
16. Classifying the states Low HCBS states: Less than median proportion of spending on HCBS in 2005
High HCBS states
Expanding HCBS states: Inflation-adjusted HCBS spending more than doubled from 1995 to 2005
Established HCBS states
18. Non-MR/DD Classification
22. Percent of MR/DD LTC expenditures spent on HCBS, 2005
24. MR/DD Classification
28. What happens when states rapidly expand HCBS? Expanding states have faster spending growth; established states contain spending
Examine states that introduced new or greatly expanded HCBS programs in late 1990s & follow subsequent LTC spending
Non-MR/DD: 9 such states
15 comparison states w/o big increases
MR/DD: 11 states
35. Conclusions HCBS programs do not break the budget
Nearly identical spending for low- and high-HCBS states confirms cost neutrality
States with well-established HCBS programs contained costs better than states with low HCBS
Institutional savings probably not automatic
HCBS expansion increases short-term spending but may cut long-term spending
Serve more people at equal or lower cost