Download
1 / 110
1.12k likes | 1.31k Views
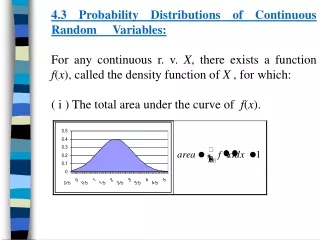
Distributions of Variables. Properties of Variables Nominal Data & Bar Charts Ordinal Data Interval & Ratio Data, Histograms & Frequency Distributions Cumulative Frequency Distributions & Percentile Ranks.

E N D
Distributions of Variables Properties of Variables Nominal Data & Bar Charts Ordinal Data Interval & Ratio Data, Histograms & Frequency Distributions Cumulative Frequency Distributions & Percentile Ranks Anthony J Greene
Variable: A characteristic that takes on multiple values. I.e.,varies from one person or thing to another. Variables Anthony J Greene
Cause and Effect The Independent Variable The Dependent Variable Variables Anthony J Greene
Distributions • The distribution of population data is called the population distribution or the distribution of the variable. • The distribution of sample data is called a sample distribution. Anthony J Greene
Variables Anthony J Greene
Kinds of Variables (any of which can be an independent or dependent variable) Qualitative variable: A nonnumerically valued variable. Quantitative variable: A numerically valued variable. Discrete Variable: A quantitative variable whose possible values form a finite (or countably infinite) set of numbers. Continuous variable: A quantitative variable whose possible values form some interval of numbers. Variables Anthony J Greene
Quantitative Variables • Discrete data: Data obtained by observing values of a discrete variable. • Continuous data: Data obtained by observing values of a continuous variable. Anthony J Greene
The Four Scales • Nominal: Categories • Ordinal: Sequence • Interval: Mathematical Scale w/o a true zero • Ratio: Mathematical Scale with a true zero Anthony J Greene
The Four Scales • Nominal: Classes or Categories. Also called a Categorical scale. E.g., Catholic, Methodist, Jewish, Hindu, Buddhist, … Qualitative Data Anthony J Greene
The Four Scales • Ordinal: Sequential Categories. e.g., 1st, 2nd, 3rd, … with no indication of the distance between classes Discrete Data Anthony J Greene
The Four Scales • Interval: Data where equal spacing in the variable corresponds to equal spacing in the scale. E.g., 1940s, 1950s, 1960s… : or SAT Scores. Discrete or Continuous Anthony J Greene
The Four Scales • Ratio: An interval scale with a mathematically meaningful zero. e.g., latencies of 1252 ms, 1856 ms, ….: mg of Prozac Discrete or Continuous Anthony J Greene
The Four Scales Nominal: No mathematical operations Ordinal: <, >, = Interval: +, -, and ordinal operations Ratio: , , and interval operations Anthony J Greene
Nominal Variables • Classes: Categories for grouping data. • Frequency: The number of observations that fall in a class. • Frequency distribution: A listing of all classes along with their frequencies. • Relative frequency: The ratio of the frequency of a class to the total number of observations. • Relative-frequency distribution: A listing of all classes along with their relative frequencies. Anthony J Greene
Frequencies of Nominal Variables Anthony J Greene
Sample Pie Charts and Bar Charts of Nominal Data Anthony J Greene
Frequency Bar Charts • Frequency bar chart: A graph that displays the independent variable on the horizontal axis -- categories -- and the frequencies -- dependent variable -- on the vertical axis. The frequency is represented by a vertical bar whose height is equal to the frequency of cases that fall within a given class of the I.V. Anthony J Greene
Frequency Charts of Nominal Data Anthony J Greene
Relative Frequency Bar Charts • Relative-frequency bar chart: A graph that displays the I.V. on the horizontal axis -- categories -- and the relative frequencies -- D.V. -- on the vertical axis. The relative frequency of each class is represented by a vertical bar whose height is equal to the relative frequency of the class. • The difference between this and a frequency bar chart is that the proportion or percentage (always between zero and one) is listed instead of the numbers that fall into a given class. Anthony J Greene
Relative Frequency Charts of Nominal Data Anthony J Greene
Probability Distribution and Probability Bar Chart Frequency Distributions and Charts for a whole population Probability distribution: A listing of the possible values and corresponding probabilities of a discrete random variable; or a formula for the probabilities. Probability bar chart: A graph of the probability distribution that displays the possible values of a discrete random variable on the horizontal axis and the probabilities of those values on the vertical axis. The probability of each value is represented by a vertical bar whose height is equal to the probability. Anthony J Greene
Probability Charts of Nominal Data Anthony J Greene
Bar Chart Anthony J Greene
The Bar Graph: Nominal Data Anthony J Greene
Sum of the Probabilities of a Discrete Random Variable For any discrete random variable, X, the sum of the probabilities of its possible values equals 1; in symbols, we haveSP(X = x) = 1. For example Republicans: 32.5%, Democrats 45.0%, Other 22.5% 0.325 + 0.450 + 0.225 = 1.00 or 100% Anthony J Greene
Ordinal Variables Note that “Rank” is the ordinal variable. “Mortality” is a ratio variable but can easily be downgraded to an ordinal variable with a loss of information Anthony J Greene
Distributions and Charts for Ordinal Data • Frequency distributions, relative frequency distribution, and probability distributions are done exactly as they were for Nominal Data • Bar charts are used. Anthony J Greene
Distribution of Education Level Anthony J Greene
Interval and Ratio Data • Frequency: The number of observations that fall in a class. • Frequency distribution: A listing of all classes along with their frequencies. • Relative frequency: The ratio of the frequency of a class to the total number of observations. • Relative-frequency distribution: A listing of all classes along with their relative frequencies. Anthony J Greene
Histograms • Frequency histogram: A graph that displays the independent variable on the horizontal axis and the frequencies -- dependent variable -- on the vertical axis. The frequency is represented by a vertical bar whose height is equal to the frequency of cases that fall within a given range of the I.V. Anthony J Greene
Interval and Ratio Variables Avg.Income (in thousands) Years of Education Anthony J Greene
Enrollment in Milwaukee Public Elementary Schools Anthony J Greene
Relative Frequency distribution of Enrollments in MPS Anthony J Greene
Probability distribution of a randomly selected elementary-school student Anthony J Greene
Probability distribution of the age of a randomly selected student Anthony J Greene
Probability Histogram Anthony J Greene
Another Example Anthony J Greene
Frequency vs. Relative Frequency Anthony J Greene
Frequency vs. Relative Frequency This is also the Probability Distribution Anthony J Greene
More Examples:Frequency Histogram Anthony J Greene
More Examples: Grouped Frequency Histogram Anthony J Greene
Grouped Frequency Histogram Anthony J Greene
Proportions and Frequency Anthony J Greene
Frequency Groupings 9 intervals with each interval 5 points wide. The frequency column (f) lists the number of individuals with scores in each of the class intervals. Anthony J Greene
Groupings: There had to be a catch • What to do with the in-betweens? • Only a concern for continuous variables • Real Limits -- those in the “14” bar are really from 13.5 to 14.5 • Upper Real Limits & Lower Real Limits: For the case of whole numbers, simply add 0.5 to the high score and subtract 0.5 from the lowest observed score (these observed scores are the “apparent limits”)
Understanding Real Limits 145 146 147 148 149 150 Anthony J Greene
Real Limits & Apparent Limits Anthony J Greene
Frequency & Cumulative Frequency Anthony J Greene