WEKA, Mahout, and MLlib Overview
WEKA, Mahout, and MLlib Overview. Sagar Samtani, Weifeng Li, and Hsinchun Chen, with updates from Shuo Yu Spring 2019, MIS 496A Acknowledgements: Mark Grimes, Gavin Zhang – University of Arizona Ian H. Witten – University of Waikato Gary Weiss – Fordham University. Outline.

WEKA, Mahout, and MLlib Overview
E N D
Presentation Transcript
WEKA, Mahout, and MLlib Overview SagarSamtani, Weifeng Li, and HsinchunChen, with updates from Shuo Yu Spring 2019, MIS 496A Acknowledgements: Mark Grimes, Gavin Zhang – University of Arizona Ian H. Witten – University of Waikato Gary Weiss – Fordham University
Outline • WEKA introduction • WEKA capabilities and functionalities • Data pre-processing in WEKA • WEKA Classification Example • WEKA Linear Regression Example • WEKA Conclusion and Resources • Appendix A – WEKA Classification and Clustering features • Appendix B – WEKA Clustering Example • Appendix C – WEKA integration with Java • Big Data Mining: Mahout/MLlib
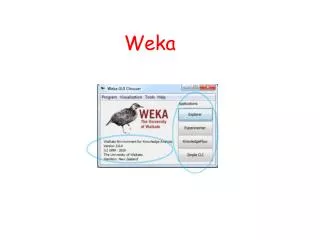
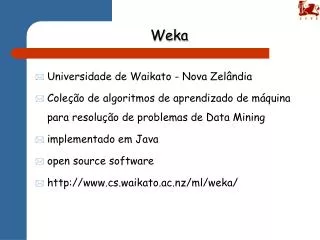
WEKA Introduction • Waikato Environment for Knowledge Analysis (WEKA), is a Java based open-source data mining tool developed by the University of Waikato. • WEKA is widely used in research, education, and industry. • WEKA can be run on Windows, Linux, and Mac. • Download from http://www.cs.waikato.ac.nz/ml/weka/downloading.html • Download WEKA 3.8.3 (stable version) • In recent years, WEKA has also been implemented in Big Data technologies such as Hadoop.
Input • Raw data • Data Mining by WEKA • Pre-processing • Classification • Regression • Clustering • Association Rules • Visualization • Output • Result WEKA’s Role in the Big Picture
WEKA Capabilities and Functionalities • WEKA has tools for various data mining tasks, summarized in Table 1. • A complete list of WEKA features is provided in Appendix A. Table 1. WEKA tools for various data mining tasks
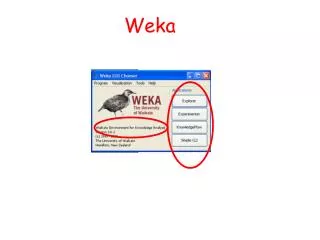
WEKA Capabilities and Functionalities • WEKA can be operated in four modes: • Explorer – GUI, very popular interface for batch data processing; tab based interface to algorithms. • Knowledge flow – GUI where users lay out and connect widgets representing WEKA components. Allows incremental processing of data. • Experimenter – GUI allowing large scale comparison of predictive performances of learning algorithms • Command Line Interface (CLI) – allowing users to access WEKA functionality through an OS shell. Allows incremental processing of data. • WEKA can also be called externally by programming languages (e.g., Matlab, R, Python, Java), or other programs (e.g., RapidMiner, SAS).
Data Pre-Processing in WEKA – Data Format • The most popular data input format for Weka is an “arff” file, with “arff” being the extension name of your input data file. Figure 1 illustrates an arff file. • Weka can also read from CSV files and databases. Name of relation @relation heart-disease-simplified @attribute age numeric @attribute sex {female, male} @attribute chest_pain_type {typ_angina, asympt, non_anginal, atyp_angina} @attribute cholesterol numeric @attribute exercise_induced_angina {no, yes} @attribute class {present, not_present} @data 63, male, typ_angina, 233, no, not_present 67, male, asympt, 286, yes, present 67, female, ?, ?, ?, present Data types for each attribute: Nominal – followed by brackets enumerating possible values Numeric – integers or floating numbers Each row of data, comma separated, a single question mark (?) if unknown
Data Pre-Processing in WEKA • We will walk through sample classification and clustering using both the Explorer and Knowledge Flow WEKA configurations. • We will use the Iris “toy” dataset. This data set has five attributes (Petal Width, Petal Length, Sepal Width, Sepal Length, and Species), and contains 150 data points. • The Iris datasets can be downloaded from the class website in Topic 1, item 23: • Download the training set (iris-train.arff, used for model training) • Download the test set (iris-test.arff, data we want to predict)
Data Pre-Processing in WEKA - Explorer • To load the Iris data into WEKA Explorer view, click on “Open File” and select the Iris-train.arff file. • After loading the file, you can see basic statistics about various attributes. • You can also perform other data pre-processing such as data type conversion or discretization by using the “Choose” tab. • Leave everything as default for now. 1 3 2
CLASSIFICATION EXAMPLES • DECISION TREE (C4.5) • RANDOM FOREST • NAIVE BAYES
WEKA Classification – Classification Examples • Let’s use the loaded data to perform classification tasks. • In the Iris dataset, we can classify each record into one of three classes - setosa, versicolor, and virginica. • The following slides will walk you through how to train various models (Decision Tree (C4.5), Random Forest, and Naïve Bayes), compare their performances, and use the best model on a set of unseen data.
WEKA Classification • First, recall that the classification process uses a training set to train a model to predict unseen data. • In our case we train, evaluate, and apply a classifier to classify flowers into their appropriate species. Decision tree Random Forest Naïve Bayes … Iris-train.arff Iris-test.arff
WEKA Classification – Decision Tree Example • A decision tree is a tree-structured plan of a set of attributes to test in order to predict the output. • There are many algorithms to build a Decision Tree (ID3, C4.5, CART, SLIQ, SPRINT, etc). • Since the Iris dataset contains continuous attributes, we will utilize C4.5 as the primary algorithm. • Represented as J48 in WEKA.
Decision Tree Training – Explorer Configurations 1 1 1 2 List of all classifiers 3 2 • You can configure the classifier accordingly. For now, you can leave all settings as default. • WEKA also allows you to select testing/training options. 10 fold cross-validation is a standard, select that. • After configuring the classifier settings, press “Start.” • After loading data, select the “Classify” tab. All classification tasks will be completed in this area. • Click on the “Choose” button. WEKA has a variety of in-built classifiers. For our purposes, select “J48.” You can use ID3 if you prefer.
Decision Tree Training – Explorer Results • After running the algorithm, you will get your model results! All of the previously run models will appear in the bottom left. • The results of your classifier (e.g., confusion matrix, accuracies, etc.) will appear in the “Classifier output” section. • You can also output results as a CSV for later processing. • You can also generate visualizations for your results by right-clicking on the model in the bottom left and selecting a visualization. • Actual decision tree and and ROC curve visualizations are provided on the right. 3 1 2 3
WEKA Classification – Random Forest Example • Random Forest is based off of bagging decision trees. • Each decision tree in the bag is only using a subset of features. • As such, there are only a few hyper-parameters we need to tune in WEKA: • How many trees to build (we will build 10) • How deep to build the trees (we will select 3) • Number of features which should be used for each tree(we will choose 2)
Random Forest Training – Explorer Configurations 1 1 1 2 List of all classifiers 3 2 • Let’s configure the classifier to have 10 trees, a max depth of 3, each tree to use 2 features. • WEKA also allows you to select testing/training options. 10 fold cross-validation is a standard, select that. • After configuring the classifier settings, press “Start.” • After loading data, select the “Classify” tab. All classification tasks will be completed in this area. • Click on the “Choose” button. WEKA has a variety of in-built classifiers. For our purposes, select “Random Forest.”
Random Forest Training – Explorer Results • After running the algorithm, you will get your results! All of the previously run models will appear in the bottom left. • The results of your classifier (e.g., confusion matrix, accuracies, etc.) will appear in the “Classifier output” section. • You can also generate visualizations for your results by right-clicking on the model in the bottom left and selecting a visualization. • Classifier errors and ROC curve visualizations are provided on the right. 3 1 2 3
WEKA Classification – Naïve Bayes Example • Naïve Bayes is a probabilistic classifier using Bayes’ theorem. • Assumes that the value of features are independent of other features and that features have equal importance. • Hence “Naïve” • WEKA supports various Bayes classifiers including Naïve Bayes and Multinomial Naïve Bayes. • We will use regular Naïve Bayes.
Naïve Bayes – Explorer Configurations 1 1 1 2 2 3 List of all classifiers • Naïve Bayes in WEKA does not need much model configuration. You can leave everything as is. • WEKA also allows you to select testing/training options. 10 fold cross-validation is a standard, select that. • After configuring the classifier settings, press “Start.” • You will get results similar to previous screenshots. • After loading data, select the “Classify” tab. All classification tasks will be completed in this area. • Click on the “Choose” button. WEKA has a variety of in-built classifiers. For our purposes, select “Naïve Bayes.”
Applying the Trained Model • Now that you have trained three different models, you can select a model to apply to unseen data. • The trained model will apply what it has learned to identify the species of a flower based on its features. • The iris-test.arff file contains records which are going to predict. Description of data Classes data will be predicted into Actual Data Question marks designate unknown classes (e.g., what we want to predict)
Applying Trained Model and Outputting Results 1 • First, select “Supplied test set” for a given model (Naïve Bayes), and point it to the iris-test.arff file. • Second, select “More options…” and change “Output predictions” to CSV. This will output the prediction results in a CSV format in the console. • Third, press “Start.” This will classify all of the records. The output will show up in a CSV format in the console. You can then use the results in further analysis tasks. 2 3 2 1 3 1
WEKA Classification – Knowledge Flow • We can also run the same classification task using WEKA’s Knowledge Flow GUI. • Select the “ArffLoader” from the “Data Sources” tab. Right click on it and load in the Iris arff file. • Then choose the “ClassAssigner” from “Evaluation” tab. This icon will allow us to select which class is to be predicted. • Then select the “Cross Validation Fold Maker” from the “Evaluation” tab. This will make the 10 fold cross- validation for us. • We can then choose a classifier from the “Classifiers” tab. • To evaluate the performance of the classifier, select the “Classifier Performance Evaluator” from the “Evaluation” tab. • Finally, to output the results, select the “Text Viewer”from the “Visualization” tab. You can then right click on the Text Viewer and run the classifier. 1 2 4 5 7 3 6
WEKA Regression – Linear Regression Example • Recall that regression is a predictive analytics technique predicting the specific value for a given data record, rather than a discrete class. • E.g., the NFL trying to predict the number of Super Bowl viewers • In this example, we will use linear regression to predict the selling price on a home based its house size, lot size, # of bedrooms/bathrooms. • Please download the houses-train.arff and houses-test.arff files from the class website. Load in the houses-train.arff file into WEKA.
Linear Regression Training – Explorer Configurations 1 1 3 • After loading in the dataset, press “Choose” and select “Linear Regression” from the functions category. Configure the settings accordingly. • Second, select “Use training set.” This will create a linear regression model for the loaded data. • Third, press “Start.” This will now create a model and provide a summary of the overall model (e.g., correlation coefficient, mean absolute error, etc.). 2 3
Linear Regression Application – Explorer Results 1 3 • After training the model, we will apply it to an unseen data point to predict its selling price. Choose the “Supplied test set” option and point it to the houses-test.arff file. • Select “More options…” and click on output predictions to CSV. • Finally, press “Start.” This will run the model, and the actual predicted value for the data point will be displayed in CSV format. 2 2 1 3
Conclusion and Resources • The overall goal of WEKA is to provide tools for developing Machine Learning techniques and allow people to apply them to real-world data mining problems. • Detailed documentation about different functions provided by WEKA can be found on the WEKA website and MOOC course. • WEKA Download – http://www.cs.waikato.ac.nz/ml/weka/ • MOOC Course – https://weka.waikato.ac.nz/explorer
Appendix A – WEKA Clustering Features • Cobweb, DBSCAN, EM, Farthest First, Filtered Clusterer, Hierarchical Clusterer, Make Density Based Clusterer, OPTICS, SimpleKMeans
Appendix B – WEKA Clustering • Clustering is an unsupervised algorithm allowing users to partition data into meaningful subclasses (clusters). • We will walk through an example using the Iris dataset and the popular k-Means algorithm. • We will create 3 clusters of data and look at their visual representations.
Appendix B – WEKA Clustering: Explorer Configuration 1 • Performing a clustering task is a similar process in WEKA’s Explorer. After loading the data, select the “Cluster” tab and “Choose” a clustering algorithm. We will select the popular k-means. • Second, configure the algorithm by clicking on the text next to the “Choose” button. A pop up will appear allowing us to choose select the number of clusters we want. We will choose 2, as that will create 3 clusters. Leave others default. • Finally, we can choose a cluster mode. For the time being, we will select “Classes to clusters evaluation.” • After configuration, press “Start” 2 3
Appendix B – WEKA Clustering: Explorer Results • After running the algorithm, we can see the results in the “Clusterer output.” • We can also visualize the clusters by right clicking on the model in the left corner and selecting visualize. 1
Appendix C – WEKA Integration with Java • WEKA can be imported using a Java library to your own Java application. • There are three sets of classes you may need to use when developing your own application. • Classes for Loading Data • Classes for Classifiers • Classes for Evaluation
Appendix C – WEKA Integration with Java – Loading Data • Related WEKA classes • weka.core.Instances • weka.core.Instance • weka.core.Attribute • How to load input data file into instances? • Every DataRow -> Instance, Every Attribute -> Attribute, Whole -> Instances # Load a file as Instances FileReader reader; reader = newFileReader(path); Instances instances = new Instances(reader);
Appendix C – WEKA Integration with Java – Loading Data • Instances contain Attribute and Instance • How to get every Instance within the Instances? • How to get an Attribute? # Get Instance Instance instance = instances.instance(index); # Get Instance Count int count = instances.numInstances(); # Get Attribute Name Attribute attribute = instances.attribute(index); # Get Attribute Count int count = instances.numAttributes();
Appendix C – WEKA Integration with Java – Loading Data • How to get the Attribute value of each Instance? • Class Index (Very Important!) # Get value instance.value(index); or instance.value(attrName); # Get Class Index instances.classIndex(); or instances.classAttribute().index(); # Set Class Index instances.setClass(attribute); or instances.setClassIndex(index);
Appendix C – WEKA Integration with Java - Classifiers • WEKA classes for C4.5, Naïve Bayes, and SVM • Classifier: all classes which extend weka.classifiers.Classifier • C4.5: weka.classifier.trees.J48 • NaiveBayes: weka.classifiers.bayes.NaiveBayes • SVM: weka.classifiers.functions.SMO • How to build a classifier? # Build a C4.5 Classifier Classifier c = new weka.classifier.trees.J48(); c.buildClassifier(trainingInstances); # Build a SVM Classifier Classifier e = weka.classifiers.functions.SMO(); e.buildClassifier(trainingInstances);
Appendix C – WEKA Integration with Java - Evaluation • Related WEKA classes for evaluation: • weka.classifiers.CostMatrix • weka.classifiers.Evaluation • How to use the evaluation classes? # Use Classifier To Do Classification CostMatrixcostMatrix = null; Evaluation eval = new Evaluation(testingInstances, costMatrix); for (inti = 0; i < testingInstances.numInstances(); i++){ eval.evaluateModelOnceAndRecordPrediction(c,testingInstances.instance(i)); System.out.println(eval.toSummaryString(false)); System.out.println(eval.toClassDetailsString()) ; System.out.println(eval.toMatrixString()); }
Appendix C – WEKA Integration with Java – Evaluation • How to obtain the training dataset and the testing dataset? Random random = new Random(seed); instances.randomize(random); instances.stratify(N); for (inti = 0; i < N; i++) { Instances train = instances.trainCV(N, i , random); Instances test = instances.testCV(N, i , random); }
Mahout • While WEKA can be run in Big Data environments, Mahout and Spark are more commonly used for Big Data applications: • Mahout is a scalable data mining engine on Hadoop (and other clusters). • “Weka on Hadoop Cluster”. • Steps: • 1) Prepare the input data on HDFS. • 2) Run a data mining algorithm using Mahout on the master node.
Spark Components – MLlib • Spark, typically installed on Hadoop, contains a distributed machine learning framework called MLlib(Machine Learning Library). • Spark MLlib is nine times as fast as the Hadoop disk-based version of Apache Mahout (before Mahout gained a Spark interface). • Spark MLlib provides a variety of classic machine learning algorithms.
Mahout vs MLlib: Input/Output • Neither tool is good at visualization. However, their output can be loaded into other software for visualization purposes (e.g., Zeppelin, Tableau, etc.)
Mahout vs MLlib: Pros and Cons • Mahout is gradually being replaced by MLlib, because MLlib runs faster on iterative tasks and has greater algorithm coverage. • As such, Mahout is redirecting towards building a fundamental math environment for creating scalable machine learning applications.
Mahout Example: Naïve Bayes • This example demonstrates the application of Naïve Bayes to classifying news into 20 news topics. • Dataset: http://people.csail.mit.edu/jrennie/20Newsgroups/20news-bydate.tar.gz • Step 1. Preprocessing (converting texts into vectors) • mahout seqdirectory -i ${WORK_DIR}/20news-all -o ${WORK_DIR}/20news-seq • mahout seq2sparse -i ${WORK_DIR}/20news-seq -o ${WORK_DIR}/20news-vectors -wttfidf
Mahout Example: Naïve Bayes • Step 1. Preprocessing Continued (splitting the dataset into training sets and testing sets) • mahout split -i ${WORK_DIR}/20news-vectors/tfidf-vectors --trainingOutput ${WORK_DIR}/20news-train-vectors --testOutput ${WORK_DIR}/20news-test-vectors --randomSelectionPct 40 --overwrite --sequenceFiles -xm sequential • Step 2. Train the classifier • mahout trainnb -i ${WORK_DIR}/20news-train-vectors -o ${WORK_DIR}/model -li ${WORK_DIR}/labelindex
Mahout Example: Naïve Bayes • Step 3. Test the classifier • mahout testnb -i ${WORK_DIR}/20news-test-vectors -m ${WORK_DIR}/model -l ${WORK_DIR}/labelindex -o ${WORK_DIR}/20news-testing • Output: • Confusion Matrix • Statistics including: Kappa, Accuracy, Reliability