Download
1 / 68
680 likes | 849 Views
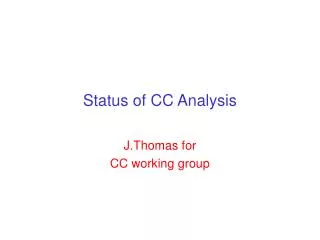
CC analysis WG report. D. Petyt, J. Nelson, J. Thomas Sep ‘04. Overview: Analysis updates with R1.9 “all event” analysis Petyt QEL analysis Smith PID techniques Likelihood vs NN PID performance in Near Detector Match-up of MC and Mock data distributions Run plan ruminations.

E N D
CC analysis WG report D. Petyt, J. Nelson, J. Thomas Sep ‘04 Overview: • Analysis updates with R1.9 • “all event” analysis Petyt • QEL analysis Smith • PID techniques • Likelihood vs NN • PID performance in Near Detector • Match-up of MC and Mock data distributions • Run plan ruminations
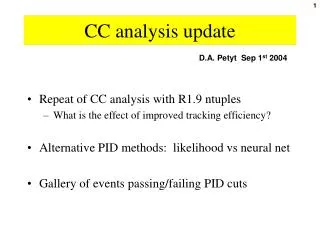
All-event CC analysis update D.A. Petyt Sep 1st 2004 • Repeat of CC analysis with R1.9 ntuples • What is the effect of improved tracking efficiency? • Alternative PID methods: likelihood vs neural net • Gallery of events passing/failing PID cuts
Effect of improved tracking in R1.9 R1.9 R1.7 R1.9 tracking better; CC selection harder (more high-y events passing cuts)
Effect of improved tracking - pmu R1.9 R1.7 R1.9 tracking improvements obvious in top-right plot
PID performance CC NC Cut at –0.4: 85% CC efficiency, 93% NC rejection
PDF distributions vs IResonance ALL QEL RES DIS True CC events only
PDF distributions vs IResonance – 2 ALL QEL RES DIS CC events that cannot be distinguished from NC
Energy resolution Showers in NC events Showers in CC events Eshw=shw.ph.GeV[0]/1.23 range
Reconstructed energy distributions CC NC reco true Reconstructed energy (GeV) Reconstructed energy (GeV) Positive bias in CC plot
Comparison of old and new 5 year plan analysis
Comparison of old and new R1.7 analysis
Comparison of old and new R1.9 analysis
Comments on spectrum ratios/allowed regions • “Old” analysis used fast MC with flux spectra/selection efficiencies sampled from histograms (usually with 1 GeV bin widths). Will tend to over-estimate number of events in very lowest energy bins. • Overall event rate lower in MDC: • 5 year plan analysis used 411.2 CC events/kt/yr/3.7e20 p.o.t. • MDC normalisation corresponds to ~350 CC events/…. • Flatter y-distribution in NEUGEN 3 makes CC/NC separation more difficult • Energy resolution – using reconstructed track momenta/shower energies rather than smearing functions
Effect of smearing – low Evis bins Bin 1: 0-0.5 GeV Bin 2: 0.5-1.0 GeV Bin 3: 1.0-1.5 GeV True neutrino energy (GeV) Histograms: true Enu of selected CC events in each of the first three visible energy bins (bin width=0.5 GeV) Dashed line: osc. prob for Dm2=0.002 eV2
Effect of smearing – 2nd Evis bin QEL RES DIS True neutrino energy (GeV) E_vis/E_true Significant smearing/eshift here
PID: comparing techniques • Looked at neural net class in ROOT (TMultiLayerPerceptron) to see how it compares with likelihood technique for separating CC and NC events • Used same variables (event length, track pulse height fraction, track ph/plane) as likelihood analysis. Only used events with evlength<50 planes (events longer than this were assumed to be CC-like) • Advantages of NN: • Correlations between variables accounted for • No binning problems • Advantages of Likelihood method: • Simplicity, transparency
Comparison of PID parameters CC NC Using re-defined PID parameter: PID=p_mu/(p_mu+p_nc) Trained NN outputs a weight: ~0 for NC events, ~1 for CC
Comparison of PID performance NN does better overall – thick red curve higher than black curve. Presumably this is because correlations between variables are taken into account Likelihood seems better for low E events Red: NN, Black: likelihood Thick: all events, Thin: E_nu<3 GeV
PID performance vs PID cut Cut on pid parameter Neural net Likelihood
Likelihood: pid>0.95 Likelihood method selects low E NC events – NC tends to dominate lowest visible energy bin
Neural net: weight>0.6 NN method selects higher energy NC events, although low E CC efficiency is suppressed
CC events passing cuts Cut is PID_lik>0.95
Classified NC by NN 49 planes long
PID with NearDet events • Using 3 samples of ND events: • ~50 ND MC files to define PDFs • ~100 ND MC files to evaluate efficiencies • ~50 ND Mock Data files to compare with MC (1 file = 550 snarls = ~18 minutes of beam) • Events are sliced and fitted using SR reco and are subjected to the following quality cuts: • Event vertex (z) between 1 and 6 m • Event vertex (x,y) <1m from beam centre • Require at least 1 good reconstructed track per event
Tracking efficiencies event track good track Difference between red and blue – failed tracks? efficiency track good track