Download
1 / 4
40 likes | 120 Views
Explore energy changes in bouncing balls. Determine the point of greatest potential energy, lowest potential energy, and greatest kinetic energy. Conduct an experiment to identify the ball that loses the most energy after six bounces. Record data, draw a multi-line graph with different colored lines for each ball, and analyze conclusions.

E N D
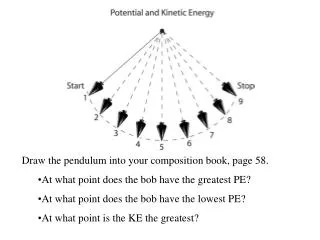
Draw the pendulum into your composition book, page 58. • At what point does the bob have the greatest PE? • At what point does the bob have the lowest PE? • At what point is the KE the greatest?
The process of energy changing from one form to another is called ________________ ___________________.
Lab: Bouncing Balls Problem: Which type of ball looses the most energy after six bounces? Procedure: • Drop each ball from 1 meter above the ground. • Measure how high each bounce is for a total of six bounces. • Repeat 3 times for each different ball.
Data and Conclusions • Average Data • Create a multi-line graph • Each ball a different color • Graph averages