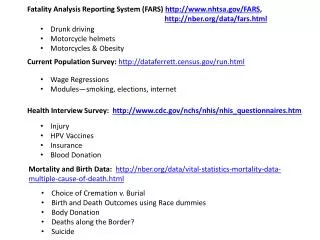
Download
1 / 18
180 likes | 299 Views
Session 38 Alcohol Data In The Fatality Analysis Reporting System (FARS) Trends and Testing Patterns. Anders Longthorne Mathematical Analysis Division. NHTSA Definitions. Blood Alcohol Concentration (BAC) BAC is measured as the weight of alcohol in the

E N D
Session 38 Alcohol Data In The Fatality Analysis Reporting System (FARS) Trends and Testing Patterns Anders Longthorne Mathematical Analysis Division
NHTSA Definitions • Blood Alcohol Concentration (BAC) BAC is measured as the weight of alcohol in the blood (grams/deciliter or g/dl). • Actively Involved Participant A Driver (including MC operators) or Non-Occupant Involved in the Fatal Crash. • Crash BAC Maximum BAC level of any Actively Involved Participant in the Fatal Crash. • Alcohol Related Driver / Non-Occupant A Driver or Non-Occupant with a Positive BAC.
In Year 2000 55 Percent of Drivers Had an “Unknown” BAC Test Result “Unknown” BAC results as Percent of all BAC results By Actively Involved Person Type Source: 1982-2000 Final FARS File
The Ten Best States for Testing Drivers BAC Source: 2000 Final FARS File
The Ten Worst States for Testing Drivers BAC Source: 2000 Final FARS File
Multiple Imputation Improves the Quality of FARS Data Rate of Driver Alcohol Testing for USA for Year 2000 Unknown = 55% Multiple Imputation calculates Values for these “Unknown” Values and allows for valid Statistical Analysis Known = 45% Source: 2000 Final FARS File
Fatality Rate closely follows Fatal Crash Rate Alcohol Related Fatal Crashes and Fatalities as a Percent of all Fatal Crashes and Fatalities Source: 1982-2000 Final FARS File
Most Alcohol Related Crashes Involve BAC levels of 0.08 g/dl or Greater. Alcohol Related Fatal Crashes as a Percent of all Fatal Crashes by the Crash BAC Source: 1982-2000 Final FARS File
Most Alcohol Related Crashes are Single Vehicle Events Alcohol Related Fatal Crashes as a % of all Fatal Crashes by the Number of Vehicles in the Crash Source: 2000 Final FARS File
Alcohol Trends of Actively Involved persons Trend of Alcohol Related Drivers, Pedestrians and Pedalcyclists Source: 1982-2000 FARS File
Fatally Injured Drivers More Likely to be Alcohol Related Alcohol Related Drivers as Percent of Drivers Involved in Fatal Crashes for Year 2000 All Surviving Drivers All Fatally Injured Drivers Alcohol Related Alcohol Related No Alcohol Related No Alcohol Related Source: 2000 Final FARS File
Fatally Injured Drivers more Likely to be Alcohol Related Alcohol Related Drivers as Percent of Drivers Involved in Fatal Crashes By Their Survival Status Source: 1982-2000 Final FARS File
Old Method – Allows for only two Alcohol Classifications for Drivers with Positive BAC Distributions of BAC for Drivers Involved in Fatal Crashes By their Survival Status (excluding BAC=0) Source: 2000 Final FARS File
New Method – Allows for 94 Alcohol Classifications for Drivers with Positive BAC Distributions of BAC for Drivers Involved in Fatal Crashes By their Survival Status (excluding BAC=0) Source: 2000 Final FARS File
Old Method – Allows for only two Alcohol Classifications for Drivers with Positive BAC Distributions of BAC for Alcohol Related Drivers Involved in Fatal Crashes By their Survival Status
New Method – Allows for 94 Alcohol Classifications for Drivers with Positive BAC Distributions of BAC for Alcohol Related Drivers Involved in Fatal Crashes By their Survival Status Source: 2000 Final FARS File
New Method – Allows for 94 Alcohol Classifications for Drivers with Positive BAC Distributions of BAC for Drivers Involved in Fatal Crashes By Prior DWI Convictions (excluding BAC=0) Source: 2000 Final FARS File