Download
1 / 32
320 likes | 669 Views
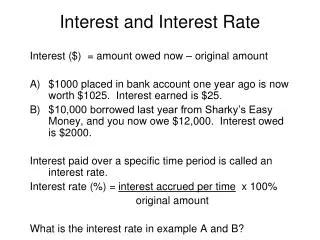
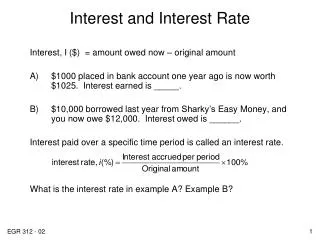
Procurement and Distribution Interest Group (PDIG) Autumn Symposium, 5th June 2008, Coventry Review of the Supply Chain Model. Michael W Thomas. Fragmented and subject to different pressures. Pharmaceuticals – A £11bn + Market. UK Market Structure By Value (2007, %). Homecare. Hospital 17%.

E N D
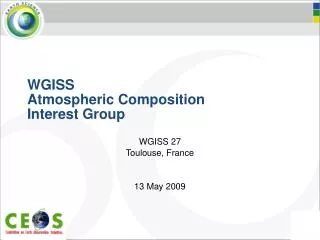
Procurement and Distribution Interest Group (PDIG)Autumn Symposium, 5th June 2008, Coventry Review of theSupply Chain Model Michael W Thomas
Fragmented and subject to different pressures Pharmaceuticals – A £11bn + Market UK Market Structure By Value (2007, %) Homecare Hospital 17% Branded Retail(40%) Retail Generics18% Parallel Trade(~10%) ZeroDiscount DispensingGPs Source: IMS; A. T. Kearney and Industry analysis
Discussion Points Where Is Healthcare Headed? What Is Happening To The Supply Chain? What Will It Look Like In The Future? Who Are The Winners & Losers?
Accelerating Expenditure Growth 4.9% p/a growth USD Bn 120 2000 USA 1600 110 400 100 Japan 350 3.5% p/a growth 300 90 NHS Total Spend (£bn) 250 Germany UK 200 80 France 150 Italy 70 100 50 60 2004 2005 2006 2007 2008 2009 2010 2011 2012 2013 2014 2015 1990 1991 1992 1993 1994 1995 1996 1997 1998 1999 2000 2001 2002 2003 2004 2005 Source: OECD Data The critical issue is affordability Developed Economies Face Funding Crisis Analysis of UK Funding Gap 1.4% p/a spending gap Source: NERA
Worker : Dependent Ratios Out Of Line Most health systems were designed for this … … but will have to deal with this reality USA UK France Germany 1950 2000 2020 2050 = Retiree = Worker Source: United Nations
There May Be Differences Of Philosophy … Government Cost Containment Mechanisms MarketStyle Mechanisms Payers • Cash Limits • Rationalization • Rationing • Regulate Drug costs • Shift to community care • User fees andco-payment • Decentralizationand autonomy • Funding Incentives • Competition • Patient choice • Commissioning • Savings Accounts Citizens Providers Access, Choice, Safety, Equality, Sustainability Suppliers
Core Service Provision Will Be Redefined Affordability gap Services whichare not cost effective Services which are cost effective to improve quality or length of life Increasingbudgetsallocatedto health Priority conditions Local epidemiology Services which reduce overall burden on the health system and country Mental health, rehabilitation Long term conditions Prevention, screening, education Generics Services considered to be essential for basic health needs Care of the Elderly Accident & Emergency care Control of infectious diseases Sanitation, nutrition DevelopedMarkets Developing Markets
Hard Choices For Net Incremental Spends GM-CSF in elderly with Leukemia £118,000/QALY • PET for Alzheimer’s disease • £250,000/QALY Bevacizumab for metastatic colorectal cancer £46-88,000 Effective use of statins ~£2,300/QALY Reduced infant mortality with rotavirus vaccination COST SAVING Intensive Glucose control of type 1 Diabetics COST SAVING Breast cancer screening £2,050/QALY Smoking cessation advice in pregnant mothers £424/QALY Suicide prevention COST SAVING £ £ Creating Life Preventing ill health Treating ill health Prolonging life Preventing Death Source: Various; A. T. Kearney Analysis
… with increasing mass adoption post expiry Push Towards Greater Use Of Generics Cost Of Prescribed Medicines Prescription Volumes Indexed Total Net Ingredient Costs (1996 = 100) Indexed Volume Growth (1996 = 100) Source: PPA Source: PPA
Case Study: Statins 300 Simvastatin 250 200 Counting Units Per Quarter (Millions) 150 Zocor 100 50 CalQtr/3/2002 CalQtr/6/2002 CalQtr/9/2002 CalQtr/3/2003 CalQtr/6/2003 CalQtr/9/2003 CalQtr/3/2004 CalQtr/6/2004 CalQtr/9/2004 CalQtr/3/2005 CalQtr/6/2005 CalQtr/9/2005 CalQtr/3/2006 CalQtr/6/2006 CalQtr/9/2006 CalQtr/12/2002 CalQtr/12/2003 CalQtr/12/2004 CalQtr/12/2005 CalQtr/12/2006 Source: IMS
Discussion Points Where Is Healthcare Headed? What Is Happening To The Supply Chain? What Will It Look Like In The Future? Who Are The Winners & Losers?
Vaccines Diabetes Ophthalmic drugs Cancer Metabolism/Endocrinology ImmuneSystem AntiInfectives Respiratory Inflammation CNS Cardiovascular Sexual Dysfunction Hormone Control Haematology Dermatology Secondary Care Drives Portfolio Growth CAGR %2004-2007 Worldwide Therapeutic Area Growth 35% • High growth • Low volume • High cost • Secondary • Biological • Slow growth • Intense generic competition • Primary • Chemical 30% 25% 20% 15% More specialistMore biological 10% More primaryMore chemical 5% 0% CAGR %2008-2011 - 5% - 5% 0% 5% 10% 15% 20% Source: Lehman Brothers Pharmapipelines, 2005 & 2007
There Is A Significant Shift To Cold-Chain Portfolio Composition By Value(Top 5 Pharma Example) 69% 62% 56% 45% Ambient Cold chain 55% 31% 38% 44% 2004 2005 2006 2007
Supply chain integrity / transparency Customer intimacy Services Commercial terms Lower total operational costs Differential deals to reflect real costs What Is On The Industry Agenda? Pressure For Change Industry Objectives • Wholesale and retail consolidation • Shift in portfolio to higher cost / specialist products • Parallel trade and counterfeit risk • Supply chain excellence focus
50% Reduction Productivity Focus In Other Industries Supply Chain Costs As A Percentage Of Sales 12.1% Administration 1.3% Inventory 2.5% 8.6% 1.2% 6.4% Warehousing 2.5% 6.1% 5.9% 1.7% 1.0% 0.8% 0.9% 0.8% 1.0% 1.8% 0.8% 1.5% 1.1% 1.6% Transport 2.5% 3.9% 3.1% 2.8% 3.2% 1987 1993 1998 2003 2008 e Source: A.T. Kearney Studies 1987 - 2004
25 20 15 10 Direct distribution for expensive products W/Sroute for low price products 5 Fee-for-service for mid-price products 0 50 100 150 200 250 300 Increasing Use Of Tiered Distribution Terms Wholesaler unit cost based on 10% Fee-for-service based on 5% of ex-factory price Distribution cost (USD/unit) Direct distribution price per pack(10 USD) Unit ex-Factory Price (USD)
OFT: Impact on Competition, NHS, Patients? Alternative Models Being Explored TraditionalModel Company / customer specific trade terms Home Delivery Models
Cost increases to the NHS Safeguard pharmacy discount Reduced service levels Clarify service level being “paid for” To be addressed as part of PPRS discussions Headlines From The OFT Report • Recognition of potential efficiency benefits of DTP • Manufacturers should be free to choose • No evidence of reduced competition in the sector
From ‘One size fits all’ Reactive care Hospital setting To Community based Responsive, adaptable,flexible service Care Will ‘Shift’ Into The Community
Specific Shift Ideas Being Tested Initial Appointment Diagnosis Treatment Follow -Up GP/Other Outpatients Simple Tests Complex Tests Non-surgical Outpatients Day Case Inpatient Step-down Care Outpatient Follow-up • Community to Self-care • Home visits or hospital-at-home • Automated telemonitoring • Self-management education and monitoring • Telemedicine consultations • Acute to Community • Primary care follow-up after discharge • Relocating specialist services to other venues • Direct GP access to hospital based tests or specialist treatment Key – Potential to provide additional activity in the community setting: Large Some Limited Source: “Our health, our care, our say”, DH 2005
Initiatives like C-Port illustrate new supply chain management partnering opportunities • Innovative partnership working • Capacity modeling • Optimising network performance • Business case support
Home Point of Care 2010 ServiceDelivery CommunicationChannel Transparency& Integrity Today CostEfficiency Extended Supply Chain Vision Consumer / Patient Ward Hospital Retail Pharmacy Wholesalers 3rd Party Logistics Local Warehouse Regional Warehouse Central Warehouse Manufacturing Centre Source: Adapted from “Pharma 2010: The value-creating supply chain”, IBM
Discussion Points Where Is Healthcare Headed? What Is Happening To The Supply Chain? What Will It Look Like In The Future? Who Are The Winners & Losers?
… as supply chain adjusts to new realities Different Growth Rates In Each Channel
CrossSubsidy Wholesale Economic Model Under Threat • High value, limited patient numbers • Mostly hospital • Increasingly ‘direct’ • Manufacturer value chain control + + Yesterday’sPortfolio Unit Value • Unprecedented generic expiries • High volume growth • Payor price pressure Tomorrow’sPortfolio + + Rate of Sale
Blended Prices Have Dropped Cross-subsidy model no longer sustainable NHS retail volumes by product price The future? Retail sales in 2003 Retail sales in 2007, excl. PFZ and AZN Pressure in use of Gx The future? Average price % packs (units) £5.5 £7.4 Pressure in use of Gx DTP £10 £20 £30 £40 Product price Source: IMS, A. t. Kearney Analysis
Aggregator / Integrator PharmacyRetailing Payor Focused Supplier Focused Pre- Wholesale Specialist Service Provider Choices Will Need To Be Made Traditional Wholesaling • Decreasing economic attractiveness • Scale and operational efficiencies • New market expansion
Multiple Retailers Dominate Breakdown of number of Retail Dispensing Points in the UK (~14,000) Potentialcross subsidy effect 32% Others Lloyds Lloyds 25% 53% 5% Boots Boots 30% 16% 16% + 9% growth p/a 31% Increasing use of differential commercial terms, reflecting buyer leverage and scale economies - 7% growth p/a Singlepharmacies DispensingDoctors Multipleownership Supermarkets Largechains Source: Taylor & Nelson, A.T. Kearney Analysis
Shape Of The Future? • 71% of respondents would pay for a home delivery service. • 30% would pay between €1-3 • 5% would pay €3-5 Source: European Study, 795 Respondents
Aggregator / Integrator Supplier Portals PharmacyRetailing Payor Focused Supplier Focused Pre- Wholesale Payor Supply Manager Specialist Service Provider Choices Will Need To Be Made Traditional Wholesaling Homecare
… being a ‘generalist’ will be unviable Future Will Drive Increasing Specialisation
Michael W. Thomas michaelwilliam.thomas@atkearney.com Principal A.T. Kearney Limited Lansdowne House +44 20 7468 8090 Direct Berkeley Square +44 796 716 8090 Mobile London W1J 6ER