Download
1 / 8
80 likes | 152 Views
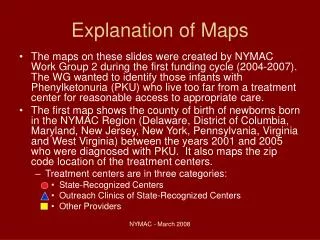
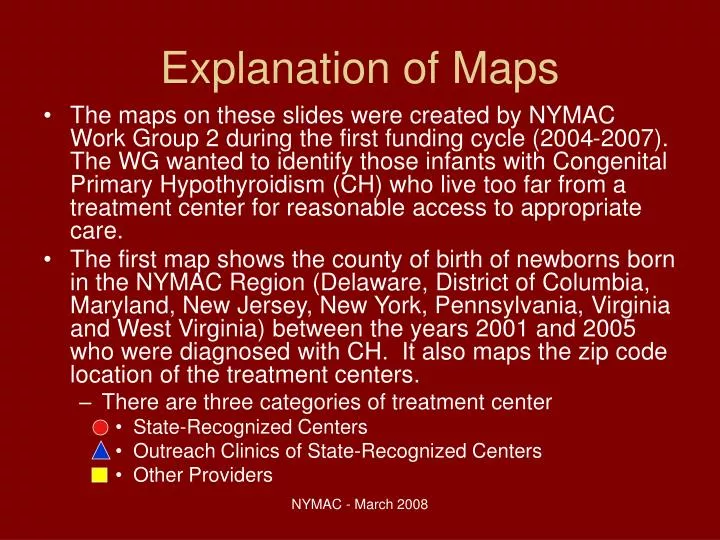
Explanation of Maps. The maps on these slides were created by NYMAC Work Group 2 during the first funding cycle (2004-2007). The WG wanted to identify those infants with Congenital Primary Hypothyroidism (CH) who live too far from a treatment center for reasonable access to appropriate care.

E N D
Explanation of Maps • The maps on these slides were created by NYMAC Work Group 2 during the first funding cycle (2004-2007). The WG wanted to identify those infants with Congenital Primary Hypothyroidism (CH) who live too far from a treatment center for reasonable access to appropriate care. • The first map shows the county of birth of newborns born in the NYMAC Region (Delaware, District of Columbia, Maryland, New Jersey, New York, Pennsylvania, Virginia and West Virginia) between the years 2001 and 2005 who were diagnosed with CH. It also maps the zip code location of the treatment centers. • There are three categories of treatment center • State-Recognized Centers • Outreach Clinics of State-Recognized Centers • Other Providers NYMAC - March 2008
Children Diagnosed with CH by State Newborn Screening Programs and All Pediatric Endocrinologists in the Counties of the NYMAC Region 2001-2005 State Recognized Endocrinology Centers State Recognized Outreach Centers Other Endocrinologists Number of Infants Diagnosed in Each County 0 Infants with CH 1-5 Infants 5-10 Infants 11-15 Infants 16-109 Infants Virginia Data 2003-2005only NYMAC - March 2008
The next two maps are close-ups of the metropolitan areas of: • New York, New Jersey and Philadelphia on slide #4 • Baltimore and Washington, DC on slide #5. NYMAC - March 2008
Children Diagnosed with CH by State Newborn Screening Programs and All Pediatric Endocrinologists in the Counties of NYMAC Region 2001-2005 (New York City, New Jersey and Philadelphia) State Recognized Endocrinology Centers State Recognized Outreach Centers Other Endocrinologists Number of Infants Diagnosed in Each County 0 Infants with CH 1-5 Infants 5-10 Infants 11-15 Infants 16-109 Infants Virginia Data 2003-2005 only NYMAC - March 2008
Children Diagnosed with CH by State Newborn Screening Programs and All Pediatric Endocrinologists in the Counties of NYMAC Region 2001-2005 (Baltimore and Washington, DC) State Recognized Endocrinology Centers State Recognized Outreach Centers Other Endocrinologists Number of Infants Diagnosed in Each County 0 Infants with CH 1-5 Infants 5-10 Infants 11-15 Infants 16-109 Infants Virginia Data 2003-2005 only NYMAC - March 2008
This last map is similar to the first map except that blue-line polygons have been drawn around the treatment centers. • The polygons represent an area approximately a one-hour travel time from the centers. • The area outside any of the shapes would be more than a hour travel time from any treatment center or outreach site. • This travel time might be too long for routine specialty care or in case of a medical emergency. NYMAC - March 2008
Children Diagnosed with CH by State Newborn Screening Programs and All Pediatric Endocrinologists in the Counties of NYMAC Region 2001-2005 State Recognized Endocrinology Centers State Recognized Outreach Centers Other Endocrinologists Number of Infants Diagnosed in Each County 0 Infants with CH 1-5 Infants 5-10 Infants 11-15 Infants 16-109 Infants Virginia Data 2003-2005 only NYMAC - March 2008
NYMAC Distance Strategy Work Group The challenge for NYMAC and the Distance Strategy Work Group is to develop, implement and evaluate strategies to make specialty care more accessible to those who live long distances from treatment centers. NYMAC - March 2008