Download
1 / 10
100 likes | 245 Views
LESSON 18: INVENTORY MODELS (STOCHASTIC) Q , R SYSTEMS OPTIMIZATION WITHOUT SERVICE. Outline Multi-Period Models Lot size-Reorder Point ( Q , R ) Systems Optimization without service Procedure Example. Procedure to find the Optimal ( Q , R ) Policy Without Any Service Constraint.

E N D
LESSON 18: INVENTORY MODELS (STOCHASTIC)Q,R SYSTEMSOPTIMIZATION WITHOUT SERVICE Outline • Multi-Period Models • Lot size-Reorder Point (Q, R) Systems • Optimization without service • Procedure • Example
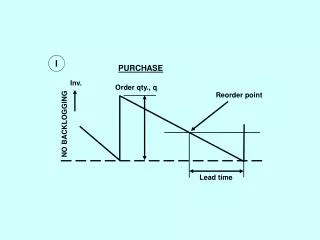
Procedure to find the Optimal (Q,R) Policy Without Any Service Constraint Goal: Given find (Q,R) to minimize total cost Step 1: Take a trial value of Q = EOQ Step 2: Find a trial value of R = where and are respectively mean and standard deviation of the lead-time demand and is the normal distribution variate corresponding to the area on the right, 1-F(z) = see Table A-4, pp. 835-841 Step 3: Find the expected number of stock-outs per cycle, where is the standardized loss function available from Table A-4, pp. 835-841
Procedure to find the Optimal (Q,R) Policy Without Any Service Constraint Step 4: Find the modified Step 5: Find the modified value of R = where is the recomputed value of the normal distribution variate corresponding to the area on the right, 1-F(z) = see Table A-4, pp. 835-841 Step 6: If any of modified Qand R is different from the previous value, go to Step 3. Else if none of Qand R is modified significantly, stop.
Example - Optimal (Q,R) Policy Annual demand for number 2 pencils at the campus store is normally distributed with mean 2,000 and standard deviation 300. The store purchases the pencils for 10 cents and sells them for 35 cents each. There is a two-month lead time from the initiation to the receipt of an order. The store accountant estimates that the cost in employee time for performing the necessary paper work to initiate and receive an order is $20, and recommends a 25 percent annual interest rate for determining holding cost. The cost of a stock-out is the cost of lost profit plus an additional 20 cents per pencil, which represents the cost of loss of goodwill. Find an optimal (Q,R) policy
Example - Optimal (Q,R) Policy Iteration 2
READING AND EXERCISES Lesson 18 Reading: Section 5.4, pp. 262-264 (4th Ed.), pp. 253-255 (5th Ed.) Exercise: 13a, p. 271 (4th Ed.), p. 261