Download

1 / 23
500 likes | 1.03k Views
Marine Environmental Impacts of Desalination plants - Intake Water and Discharges. Mohammad Qurban, Krishnakumar. P. K. and Manikandan. K. P. Center for Environment and Water Research Institute King Fahd University of Petroleum and Minerals Dhahran. THE MARINE ENVIRONMENT.

E N D
Marine Environmental Impacts of Desalination plants - Intake Water and Discharges Mohammad Qurban, Krishnakumar. P. K. and Manikandan. K. P. Center for Environment and Water Research Institute King Fahd University of Petroleum and Minerals Dhahran
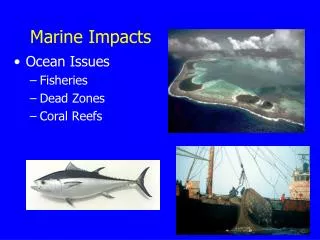
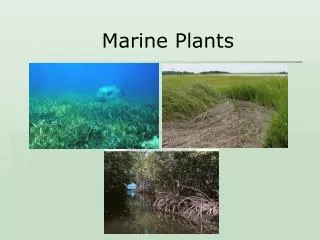
THE MARINE ENVIRONMENT • The Arabian Gulf and Red Sea are the major source of seafood, as well as two of the most precious and coveted resources— water and oil • Within the Gulf, there are different types of sensitive habitats in which plants and animals live such as • These rich and diverse ecosystems are experiencing physical and chemical stresses mainly due to man-made activities such as: • Industrial development, • Desalination plants and • Oil exploration Salt Marshes Mangroves Seagrasses Coral reefs
DESALINATION – FACTS & FIGURES • Worldwide, only 1% of drinking water is produced by desalination, supplied by more than 12,500 plants in more than 120 countries amounting to 24.5 million m3/day (ETAP, 2008). • The market volume has soared from $ 2.5 billion in 2002 to $ 3.8 billion in 2005 with a growth rate of over 15% per annum (Lattemann and Höpner 2008). • The regions of the Middle East clearly dominate the demand (over 50% of the market share), followed by Asia-Pacific, America, and Europe that share about 10% of the market respectively (Lattemann and Höpner 2008). • Of which KSA ranks first in overall capacity with approximately 23% (Lattemann and Höpner 2008). • It is estimated that by the year 2025, the Arabian Gulf Region would demand approximately 137 billion m3/year (Lattemann and Höpner 2008).
DESALINATION – Regional Distribution of Capacities (from Lattemann and Höpner 2008)
PRODUCTION IN SAUDI ARABIA Working plants along the West Coast: JEDDAH, AL-SHOAIBAH, YANBU, AL-SHUQAIQ, HAQL, DUBA, AL-WAJH, UMMLUJ, RABIGH, AL-AZIZIYAH, AL-BIRK, FARASAN, AL-QUNFIDAH Working plants along the East Coast: AL-KHOBAR, AL-KHAFJI AND AL-JUBAIL Source: http://www.swcc.gov.sa/
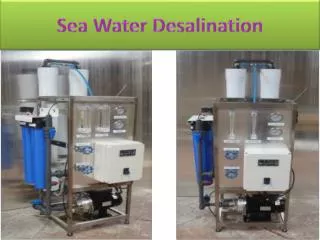
THE PROCESS OF DESALINATION Heat / Power Screening,Filtration Desalination Plant DirectDischarge Seawater Intake Addition of Chemicals (Anti-Scaling , Anti-Foaming, Anti-Corrosion, Desinfection etc).
IMPACTS DUE TO INTAKE • The intake seawater is not mere seawater but a habitat which contains an entire ecosystem of phytoplankton, zooplankton, larval forms of invertebrates and fishes. • Major impact of intake is loss of Aquatic life and biodiversity • Animals larger than the mesh – injury or death due to impinging effect • Animals smaller than the mesh – Entrained into the plant and killed by thermal and chemical alterations. • Construction of the intake structure causes disturbance of the seabed which results in: • Re-suspension of sediments. • Release of nutrients and pollutants into the water column.
Continued… • Entrainment & impingement Impingement Entrainment PLANT • Impingement occurs when marine organisms are trapped against intake screens by the velocity and force of water flowing through them. • Entrainment occurs when smaller organisms pass through an intake screen and into the process equipment.
IMPACTS DUE TO DISCHARGE • Salinity increase (Brine) • Temperature increase • Toxicity due to chemicals (chlorine, trace metals etc.)
Continued… • Brine (high salinity) • Dense brine water (in RO plants) sinks to the sea bottom, impacting the benthic communities. • Depleting the available dissolved oxygen near the bottom, causing hypoxic (low oxygen) conditions. • Temperature • Death due to thermal shock • Increased proliferation of Harmful algal blooms • Coral bleaching • Decreased larval survival
Continued… • Chemicals • Pretreatment and Post treatment • Avoiding biofouling • Suspended solids • Accumulation and • Scale deposits • Cleaning chemicals Examples of commonly used chemicals • Sodium hypochlorite • To prevent biological growth • Ferric chloride • To remove suspended matter • Sulfuric acid • To adjust the pH • Sodium hexameta phosphate • To prevent Scale formation • Sodium bisulphate • To neutralize residual Chlorine • EDTA • To remove Carbonate deposits • Citric acid • To clean the membrane Nata Sea Water Desalination Plant in Japan (From: Younos, 2005)
Continued… Impacts of chemicals • Chlorine • Potent Biocide • High reactivity with organics • Forms Chlorinated/Halogenated byproducts • Carcinogenic • Trace metals • Sediments – tends to accumulate trace metals from discharges. • Selectively accumulated by organisms to much larger concentrations that can cause toxicity- Bioaccumulation. • Increases many folds along the food chain (Biomagnification). • Becomes highly toxic for human consumption.
MITIGATION MEASURES FOR INTAKE • Mitigating entrainment SELECTION OF INTAKE • Proper site selection for intake reduces the aquatic loss caused due to entrainment.
Continued… • Mitigating impingements
Continued… • Behavioural technologies • Light • Most impingement of fishes has been noted to be greater at night. • Underwater Strobe lights elicit an avoidance response and are more effective. • Acoustic fish deterrents • High frequency sounds (10 Hz - 3 KHz )have been most successful at repelling most pelagic fishes. • Velocity cap • Works on the principle that fish avoid rapid changes in horizontal flow and are relatively insensitive to vertical velocities.
Continued… • Subsurface intake • Vertical beach wells • Horizontal directional drilling (HDD) • Design includes geological structures such as porous rocks, sea mud, sand and other seabed material between the intake and the sea, limiting the intake with its water permeability. • Eliminate entrainment and impingement by providing a level of pre-filtration
MITIGATION MEASURES FOR DISCHARGES • Focus on 3 Aspects • Discharge Dispersion • Effluent Composition and • Environmental Impact Assessment • Do not discharge close to sensitive habitats (Corals, seagrass etc.) • Conduct hydrodynamic modeling study to identify discharge locations • Select discharge locations to have best dilution and dispersion • Use of hazardous chemicals could either be replaced or treated before discharge (For eg., Chlorine can be removed by adding Sodium bisulfite). • Provide nozzles to discharge pipeline for to improve mixing • Conduct Real Time monitoring of marine environment near discharge (Example: Use Real Time Monitoring Buoys. Monitoring Buoys
Continued… • Modeling the temperature profile of outfall
CONCLUSIONS • The current US EPA standard requires that the best available technology should be used in order to achieve impingement reduction of 85-95% and entrainment reduction of 60-90%. • The design and location of the intake should be site specific, adjusted to the particularity of the local marine ecosystems. • A desalination facility has to improve its recycling techniques using the Best Available Technology thereby preventing dangerously high concentrations in the discharge. • The facility has to monitor regularly the pollutant concentrations of the discharge to that of the national ambient standards (PME) or environmental quality standards of various international organizations like ANZECC and NOAA. • Good and effective management practices during intake and discharges will help produce sweet potable water and electricity with least environmental impacts.