Download
1 / 26
260 likes | 348 Views
Explore a unified framework for transferring knowledge across diverse data distributions. Learn about sample selection bias, uncertainty mining, and adaptive graph transduction. Enhance classifier performance and tackle different but similar challenges efficiently.

E N D
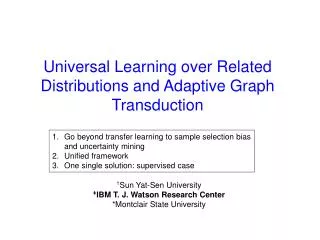
Universal Learning over Related Distributions and Adaptive Graph Transduction Erheng Zhong†, Wei Fan‡, Jing Peng*, Olivier Verscheure‡, and Jiangtao Ren† †Sun Yat-Sen University ‡IBM T. J. Watson Research Center *Montclair State University • Go beyond transfer learning to sample selection biasand uncertainty mining • Unified framework • One single solution: supervised case
Standard Supervised Learning training (labeled) test (unlabeled) Classifier 85.5% New York Times New York Times 2
Sample Selection Bias training (labeled) test (unlabeled) Classifier 78.5% 85.5% New York Times New York Times Have a different word vector distribution August: a lot about typhoon in Taiwan September: a lot about US Open 3
Uncertainty Data Mining • Training Data: • Both feature vectors and class labels contain noise (usually Gaussian) • Common for data collected from sensor network • Testing data: • Feature vector contain noises
Summary • Traditional supervised learning: • Training and testing data follow the identical distribution • Transfer learning: • from different domains • Sample selection bias: • from same domain but distribution is different • such as, missing not at random • Uncertain data mining: • data contains noise • In other words: in all three cases, training and testing data are from different distributions. • Traditionally, each problem is handled separately.
Main Challenge Could one solve these different but similar problems under a uniform framework? With the same solution? Universal Learning
Universal Learning • is the subsets of X that are the support of some hypothesis in a fixed hypothesis space ([Blitzer et al, 2008] • The distance between two distributions ([Blitzer et al, 2008]
How to Handle Universal Learning? • Most traditional classifiers could not guarantee the performance when training and test distributions are different. • Could we find one classifier under weeker assumption? Graph Transduction?
Advantage of Graph Transduction Weaker assumption that the decision boundary lies on the low density regions of the unlabeled data. Two-Gaussians vs. Two-arcs
Just Graph Transduction? • “Un-smooth label”(more examples in low density region) and “class imbalance” problems ([Wang et al, 2008]) may mislead the decision boundary to go through the high density regions. • Bottom part closestred square • More red square thanblue square Sample Selection: which samples?
Maximum Margin Graph Transduction In margin-terms, unlabeled data with low margin are likely misclassified! Good sample Bad sample
Main Flow Predict the labels of unlabeled data Maximize the unlabeled data margin Lift the unlabeled data margin
Properties Adaptive Graph Transduction can be bounded Training error in terms of approximating the ideal hypothesis Emprical distance between training and test distribution Error of the ideal hypothesis
Properties If one classifier has larger unlabeled data margin, it will make the training error smaller (recall last theorem) Average ensemble is likely to achieve larger margin
Experiment – Data Set Transfer Learning Reuters: 21758 Reuters news articles SyskillWebert: HTML source of web pages plus the ratings of a user on those web pages SyskillWebert Reuters Target-Domain Source-Domain Sheep Bands-recording First fill up the “GAP”, then use knn classifier to do classification Biomedical org place Goats Target-Domain org.subA place.subA First fill up the “GAP”, then use knn classifier to do classification org.subB place.subB Source-Domain
Experiment – Data Set Sample Selection Bias Correction UCI data set: Ionosphere, Diabetes, Haberman, WDBC Feature 1 Feature 2 • Uncertainty Mining • Kent Ridge Biomedical Repository: high dimensional, low sample size (HDLSS) • Randomly select 50% of the features, and then sort the data set according to each selected features; • we attain top instances from every sorted list as training set; Generate two different Gaussian Noises and add them into training and test set
Experiment -- Baseline methods Original graph transduction algorithm ([Zhu, 2005]) Using the entire training data set Variation: choosing a randomly selected sample whose size is equal to the one chosen by MarginGraph CDSC: transfer learning approach ([Ling et al, 2008]) find a mapping space which optimizes over consistency measure between the out-domain supervision and in-domain intrinsic structure BRSD-BK/BRSD-DB: bias correction approach ([Ren et al, 2008]) discover structure and re-balance using unlabeled data
Performance--Sample Selection Bias Accuracy: Best on all 4 data sets! AUC: Best on 2 of 4 data sets.
Performance--Uncertainty Mining Accuracy: Best on all 4 data sets! AUC: Best on all 4 data sets!
Margin Analysis MarginBase is the base classifier of MarginGraph in each iteration. LowBase is a “minimal margin classifier” which selects samples for building a classifier with minimal unlabeled data margin. LowGraph is the averaging ensemble of LowBase.
Maximal margin is better than minimal margin Ensemble is better than any single classifiers
Conclusion Cover different formulations where the training and test set are drawn from related but different distributions. Flow Step-1 Sample selection -- Select labeled data from different distribution which could maximize the unlabeled data margin Step-2 Label Propagation -- Label the unlabeled data Step-3 Ensemble -- Further lift the unlabeled data margin Code and data available fromhttp://www.cs.columbia.edu/~wfan
Thank you Hvala lepa