Download
1 / 44
440 likes | 520 Views
Climate change: the scien tific essentials for a future framework. Diana Ü rge-Vorsatz March 13, Budapest. Outline. Introduction Evidence of CC Future scenarios and impacts Costs of CC Emission reduction needs and Fundamentals of mitigation Sharing the burden (opportunity?) in CEE.

E N D
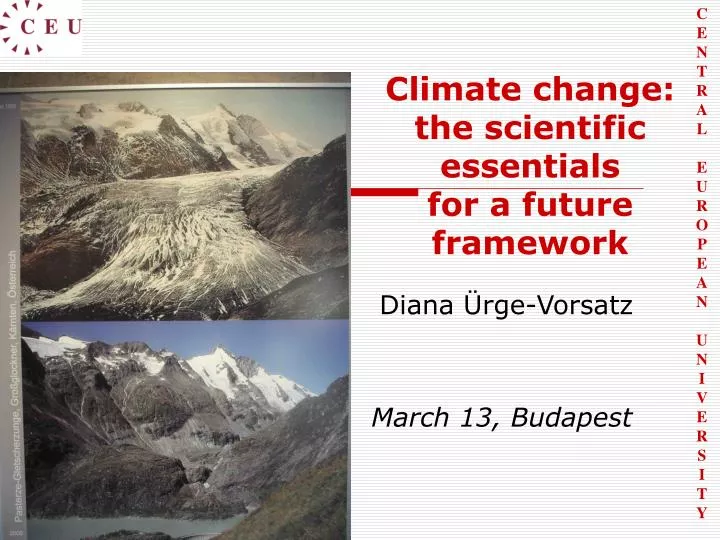
Climate change: the scientific essentials for a future framework Diana Ürge-Vorsatz March 13, Budapest
Outline • Introduction • Evidenceof CC • Future scenarios and impacts • Costs of CC • Emission reduction needs and Fundamentals of mitigation • Sharing the burden (opportunity?) in CEE
Greenhouse effect • Greenhouse effect is a natural mechanism, which maintains the temperature of the Earth 33°C warmer than if it had no GHG “layer” • (global average temperature is 15 °C).
Global-average radiative forcing estimates and ranges:Used to compare different drivers of climate change
Global Warming Potential (GWP) weighted global greenhouse gasemissions 1970-2004 Source: IPCC AR4 2007
The Evidence - Direct Observations of Recent Climate Change Warming of the climate system is unequivocal, as is now evident from observations of increases in global average air and oceantemperatures, widespread melting of snow and ice, and rising global mean sea level. • The global average surface temperature has increased at the 100-year trend (1906–2005) of 0.74°C ± 0.18°C. Source: Pachauri and Jallow, 2007.
Projections of Future Changes in Climate • For the next two decades a warming of about 0.2°C per decade is projected for a range of SRES emission scenarios. • Even if the concentrations of all greenhouse gases and aerosols had been kept constant at year 2000 levels, a further warming of about 0.1°C per decade would be expected. • The commitments to climate change after stabilisation of radiative forcing are expected to be about 0.5 to 0.6°C, mostly within the following century. Source: Pachauri and Jallow, 2007.
Projections of future changes in climate (selection) • Anthropogenic warming and sea level rise would continue for centuries due to the timescales associated with climate processes and feedbacks, even if greenhouse gas concentrations were to be stabilized. • Temperatures in excess of 1.9 to 4.6°C warmer than pre-industrial sustained for millennia…eventual melt of the Greenland ice sheet. Would raise sea level by 7 m. Source: IPCC, AR4, WG I. 2007
Projections of Future Changes in Climate Projected warming in 21st century expected to be greatest over land and at most high northern latitudes and least over the Southern Ocean and parts of the North Atlantic Ocean Source: IPCC, AR4, WG I. 2007.
Source: IPCC, AR4, WG I. 2007. Projected change in precipitation for the period 2080 to 2099 relative to 1980 to 1999, SRES A1B
Agro-economic vulnerability to future climate change (2061–2070) based on loss of agricultural productivity. Solar radiation, atmospheric CO2 concentration, temperature, soil moisture, nutrient availability, and farming practices are represented using nonlinear (process-based or empirical) functions, implemented through the agricultural crops component in the LPJ model (Bondeau et al., 2007). Adaptation of farming practices is considered by allowing shifts in planting dates, varieties, and irrigation (Rosenzweig and Iglesias, 2003). If a significant yield loss in at least one important crop was identified in a country where the GDP share of agriculture is greater than 5%, then vulnerability was ranked as “high.” In the case of low dependency on agriculture and a decrease in only one significant crop yield (or no decrease at all), vulnerability was ranked as “low.” The remaining two combinations were ranked as “medium.”
Temperature This map illustrates what can be expected in Europe by the end of the century, according to the IPCC scenario (SRES A2) whereby no action is taken to reduce greenhouse gas emissions, so that the global mean temperature increases by about 3.4°C by the 2080s compared to 1990 levels. Under this scenario, nearly all European regions are expected to be negatively affected and up to half of Europe’s plant species could be vulnerable or threatened by 2080. Source: Commission Adaptation Green Paper; 2007.
10 y 10 y extremely rare event 100 y 100 y mean 1000 y 1000 y Source: Johansson, 2006, CEU lecture. European heat-wave 2003 - estimation of return periods Swiss Temperature Series 1864-2003 (mean of 4 stations) (Schär et al. 2004, Nature, 427, 332-336) More elaborate analysis shows it likely that most of the risk of the event due to increase in greenhouse gases - also that by 2050, likely to be average event and by 2100 a cool event (Stott et al 2004, Nature 432 610-614).
Precipitation This map illustrates what can be expected in Europe by the end of the century, according to the IPCC scenario (SRES A2) whereby no action is taken to reduce greenhouse gas emissions, so that the global mean temperature increases by about 3.4°C by the 2080s compared to 1990 levels. Under this scenario, nearly all European regions are expected to be negatively affected and up to half of Europe’s plant species could be vulnerable or threatened by 2080. Source: Commission Adaptation Green Paper; Marr, SUN presentation, 2007.
Stabilisation and commitment to warming Source: Stern Review, 2007.
Projected CO2 emissions leading to stabilisation at different levels • The lower the stabilisation level the earlier global CO2 emissions have to peak IPCC AR4 (2007), WGI. The first figure shows the assumed trajectories of CO2 concentration (SP scenarios); the second shows the implied CO2 emissions, as projected with the Bern2.5CC EMIC. The upper and lower bounds are indicated by the top and bottom of the shaded areas. Alternatively, the lower bound (where hidden) is indicated by a dashed line.
Long term mitigation (after 2030) Source: IPPC, AR4, WG III, 2007. Mitigation efforts over the next two to three decades will have a large impact on opportunities to achieve lower stabilization levels [1] The best estimate of climate sensitivity is 3ºC [WG 1 SPM]. [2] Note that global mean temperature at equilibrium is different from expected global mean temperature at the time of stabilization of GHG concentrations due to the inertia of the climate system. For the majority of scenarios assessed, stabilisation of GHG concentrations occurs between 2100 and 2150. [3] Ranges correspond to the 15th to 85th percentile of the post-TAR scenario distribution. CO2 emissions are shown so multi-gas scenarios can be compared with CO2-only scenarios.
Stabilisation targets • Current evidence suggests a stabilisation need of 450 – 550ppm CO2-eq • Anything higher has very harmful impacts • Anything lower raises costs significantly and may not even be feasible any more • However, little can now be done to change the likely adverse effects that some developing countries will face in the next few decades, and so some adaptation will be essential. • Strong and early mitigation is the only way to avoid some of the more severe impacts that could occur in the second half of this century. Source: Stern Review, 2007. www.sternreview.org.uk
Key challenge for appropriate response to climate change • Exceeding 2-2.5° C above 1750 levels would entail sharply increasing risk of intolerable impacts • Avoiding this will require prompt action • Two-pronged strategy: avoid the unmanageable (mitigation) and manage the unavoidable (adaptation) • Mitigation and adaptation measures should be integrated and reinforcing Source: Urge-Vorsatz. 2007. Presentation of the UN SEG Report
Total cost of CC • The total cost of BAU CC is app. a 20% reduction in consumption per head, “now and into the future” (Stern Review, Executive summary, p. x) Source: The Stern Review, 2007. www.sternreview.org.uk
Illustration of costs numbers for stringent mitigation GDP GDP without mitigation 80% 77% GDP with stringent mitigation Time current ~1 year Source: IPPC, AR4, WG III, 2007.
The Three Key Pillars of Mitigation Strategies • Lowering the energy intensityof economic activity through increases in the efficiency of vehicles, buildings, appliances, and industrial processes • Lowering the carbon-emissions intensity of energy supply through additions of renewable and nuclear energy supply and through modifications to fossil fuel technologies that enable the capture and sequestration of CO2 • Reducing the carbon emissions from land-use change by means of reforestation, afforestation, avoided deforestation, and improved soil-management practices in agriculture Source: Urge-Vorsatz. 2007. Presentation of the UN SEG Report
Sectoral economic potential for global mitigation for different regions as a function of carbon price, 2030
Estimated potential for GHG mitigation at a sectoral level in 2030 in different cost categories , transition economies
Mitigation portfolio for electricity, 2030 Source: IPPC, AR4, WG III, 2007. Improved energy-efficiency in buildings can supply the largest mitigation reduction, comparable to all renewable energy generation, and to other measures combined
Per Capita and Total Emissions of Greenhouse Gases in Year 2000 Source: UN SEG 2007, www.confrontingclimatechange.org
CO2 emissions per capita Source: IEA Key Statistics, 2007
CO2 per TPES Source: IEA Key Statistics, 2007
Emission reductions for Eastern Europe under different regimes in comparison to baseline 2025 2050 % % 0 0 Brazilian Per Capita Jacoby Rule Preference Brazilian Jacoby Rule -10 Proposal -20 Proposal Convergence Score Preference -20 Per Capita Multi Stage -40 Multi-Stage Score Convergence -30 -60 -40 -80 -50 -100 -60 -120 -70
Fossil CO2 emissions in Eastern Europe and FSU: different regimes The purple line is the baseline Source: Den Elzen et al 2003.
Conclusion • The evidence of anthropogenic climate change is now unequivocal • All countries in CEE are and will be badly affected, although severity and type of impacts vary • Avoiding dangerous impacts requires urgent and strong action today • Emission reduction needs for CEE in 2025 are 30 – 50%, while for above 80% for 2050 • However, the AR4 concludes that this is feasible, and The costs of even the more ambitious stabilisation targets are not substantial if action starts today • Many mitigation options are associated with economic and social benefits. For instance, capturing the cost-effective potential in buildings can supply 38% of mitigation needs in 2030 for a 3C target. CEE has especially high potential.
THANK YOU FOR YOUR ATTENTION! For more questions: Vorsatzd@ceu.hu
References • Publications: • UN SEG. (2007). Confronting climate change challenge: Avoiding the unmanageable, managing the unavoidable. Scientific Expert Group report on Climate Change and Sustainable Development. URL: http://www.unfoundation.org/files/pdf/2007/SEG_Report.pdf • Presentations: • Johannson, T. B. (2006). Greenhouse Gas Emissions and Climate Change. Lecture at the CEU, October 30, 2006. • Pachauri, R. K. and Jallow, B. (2007). Climate change 2007: The Physical Science Basis. Working group I contribution to the Fourth Assessment Report of the IPCC. Nairobi, 6 February, 2007. URL: http://www.ipcc.ch/present/presentations.htm Accessed on September 8, 2007. • Manning, M. (2007) Climate Change 2007: Observations and Drivers of Climate Change. • Graphics: • Planets and atmospheres. (2000). In UNEP/GRID-Arendal Maps and Graphics Library. Retrieved 02:48, September 9, 2007 from http://maps.grida.no/go/graphic/planets_and_atmospheres. • Greenhouse effect. (2002). In UNEP/GRID-Arendal Maps and Graphics Library. Retrieved 15:16, September 8, 2007 from http://maps.grida.no/go/graphic/greenhouse_effect. • Cooling factors. (2000). In UNEP/GRID-Arendal Maps and Graphics Library. Retrieved 23:29, September 10, 2007 from http://maps.grida.no/go/graphic/cooling_factors.