Download
1 / 1
10 likes | 102 Views
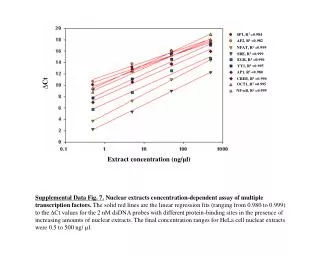
Explore concentration-dependent assay results of transcription factors in HeLa cell nuclear extracts using dsDNA probes with varied protein-binding sites. The linear regression fits range from 0.980 to 0.999 for ∆Ct values.

E N D
SP1, R2 =0.984 AP2, R2 =0.982 NFAT, R2 =0.999 SRE, R2 =0.999 EGR, R2 =0.990 YY1, R2 =0.995 AP1, R2 =0.980 ∆Ct CREB, R2 =0.990 OCT1, R2 =0.995 NF-κB, R2 =0.999 Extract concentration (ng/μl) Supplemental Data Fig. 7. Nuclear extracts concentration-dependent assay of multiple transcription factors. The solid red lines are the linear regression fits (ranging from 0.980 to 0.999) to the ∆Ct values for the 2 nM dsDNA probes with different protein-binding sites in the presence of increasing amounts of nuclear extracts. The final concentration ranges for HeLa cell nuclear extracts were 0.5 to 500 ng/ µl.