
Understanding Survey Data: Key Metrics and Terminology Explained
This guide demystifies essential survey metrics for analyzing data effectively. Learn about sample respondents, their significance in a study, and how weighted counts reflect projected numbers of U.S. adults aligning with given criteria. Explore vertical percentages, which indicate the proportion of column participants met by row criteria, and horizontal percentages that show the row’s contribution to the column. Additionally, understand the index, which benchmarks data in relation to a base value of 100, representing the average individual. Boost your data interpretation skills with these key concepts.

Understanding Survey Data: Key Metrics and Terminology Explained
E N D
Presentation Transcript
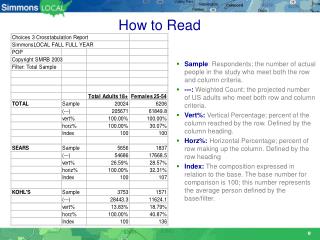
How to Read • Sample: Respondents; the number of actual people in the study who meet both the row and column criteria. • ---: Weighted Count; the projected number of US adults who meet both row and column criteria. • Vert%: Vertical Percentage; percent of the column reached by the row. Defined by the column heading. • Horz%: Horizontal Percentage; percent of row making up the column. Defined by the row heading • Index: The composition expressed in relation to the base. The base number for comparison is 100; this number represents the average person defined by the base/filter.