Download

1 / 17
170 likes | 177 Views
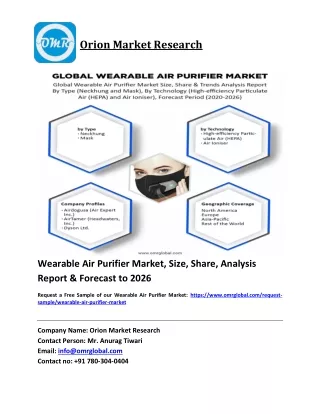
United States air purifier market stood at around $ 3039.74 million in 2019 and is projected to grow over CAGR 6.7% during the forecast period, on account of rising concerns about indoor and outdoor air pollution. https://bit.ly/32rrBRk

E N D
2016 – 2026 UNITED STATES AIR PURIFIERS MARKET FORECAST AND OPPORTUNITIES Published: April 2021 www.techsciresearch.com MARKET INTELLIGENCE . CONSULTING
Table of Contents S. No. Contents 1. Product Overview 2. Research Methodology 3. Executive Summary 4. Voice of Customer 5. Global Air Purifiers Market Overview 6. United States Air Purifiers Market Outlook 6.1. Market Size & Forecast 6.1.1. By Value & Volume 6.2. Market Share & Forecast 6.2.1. By Filter Type (HEPA + Activated Carbon; Pre-Filter + HEPA; HEPA; and Others) 6.2.2. By End Use (Residential/Household Vs. Non-Residential/Commercial) By Distribution Channel (Direct/Institutional Sales; Offline Retail Sales; and Online Retail Sales) 6.2.3. 6.2.4 By Region (South; West; Mid-West; and North-East) 6.2.5. By Company, 2020 Product Market Map (By Filter Type; By Distribution Channel; and By Region) 6.3. 2 © TechSci Research
Table of Contents S. No. Contents 7. United States HEPA + Activated Carbon Air Purifiers Market Outlook 7.1. Market Size & Forecast By Value & Volume 7.1.1. 7.2. Market Share & Forecast By End Use 7.2.1. 7.2.2. By Distribution Channel 7.3. Product Benchmarking (Including Pricing Analysis) 8. United States Pre-Filter + HEPA Air Purifiers Market Outlook 8.1. Market Size & Forecast By Value & Volume 8.1.1. 8.2. Market Share & Forecast By End Use 8.2.1. 8.2.2. By Distribution Channel 8.3. Product Benchmarking (Including Pricing Analysis) 9. United States HEPA Air Purifiers Market Outlook 9.1. Market Size & Forecast By Value & Volume 9.1.1. 9.2. Market Share & Forecast By End Use 9.2.1. 9.2.2. By Distribution Channel 9.3. Product Benchmarking (Including Pricing Analysis) 3 © TechSci Research
Table of Contents S. No. Contents 10. Value Chain Analysis 11. Import & Export Analysis 12. Market Dynamics 12.1. Drivers 12.2. Challenges 13. Market Trends & Developments 14. Policy & Regulatory Landscape 15. United States Economic Profile 16. Competitive Landscape 16.1. Competition Outlook 16.2. Company Profiles 16.2.1. Austin Air Systems Ltd. 16.2.2. IQAir North America, Inc. 16.2.3. Blueair Inc. 16.2.4. Honeywell International, Inc. 16.2.5. Whirlpool Corporation 16.2.6. Rabbit Air 16.2.7. Sharp Electronics Corporation 16.2.8. Winix America Inc. 16.2.9. Coway USA Inc. 16.2.10. Alen Corporation 17. Strategic Recommendations 18. About Us & Disclaimer 4 © TechSci Research
List of Figures Title Air Coolers S. No. Figure 1: United States Air Purifier Market Size, By Value (USD Million), By Volume (Thousand Units) 2016-2026F Figure 2: United States Particulate Matter 10 (PM10) Levels, 2015 - 2019 Figure 3: United States Air Purifier Market Share, By Filter Type, By Value, 2016-2026F Figure 4: United States Commercial Vehicle Registrations or Sales (Million Units), 2011 - 2020 Figure 5: United States Air Purifier Market Share, By End Use, By Value, 2016-2026F Figure 6: United States Air Purifier Market Share, By Distribution Channel, By Value, 2016-2026F Figure 7: United States Passenger Car Registrations or Sales (Million Units), 2011 - 2020 Figure 8: United States Air Purifier Market Share, By Region, By Value, 2016-2026F Figure 9: United States Air Purifier Market Share, By Company, By Value, 2020 Figure 10: United States Air Purifiers Market Map, By Filter Type, Market Size (USD Million) & Growth Rate (%) United States Air Purifiers Market Map, By Distribution Channel, Market Size (USD Million) & Growth Rate (%) Figure 11: Figure 12: United States Air Purifiers Market Map, By Region, Market Size (USD Million) & Growth Rate (%) United States HEPA + Activated Carbon Air Purifier Market Size, By Value (USD Million), By Volume (Thousand Units) 2016-2026F Figure 13: Figure 14: United States Particulate Matter 2.5 (PM2.5) Levels, 2015 - 2019 Figure 15: United States HEPA + Activated Carbon Air Purifier Market Share, By End Use, By Value, 2016-2026F United States HEPA + Activated Carbon Air Purifier Market Share, By Distribution Channel, By Value, 2016-2026F Figure 16: Figure 17: United States Personal Health Care Expenditures (USD Trillion), 2012 - 2018 5 © TechSci Research
List of Figures S. No. Title Air Coolers United States Pre-Filter + HEPA Air Purifier Market Size, By Value (USD Million), By Volume (Thousand Units) 2016-2026F United States Sulphur Dioxide (SO2) Levels, 2015 - 2019 Figure 18: Figure 19: Figure 20: United States Pre-Filter + HEPA Air Purifier Market Share, By End Use, By Value, 2016-2026F United States Pre-Filter + HEPA Air Purifier Market Share, By Distribution Channel, By Value, 2016- 2026F United States HEPA Air Purifier Market Size, By Value (USD Million), By Volume (Thousand Units) 2016- 2026F Figure 21: Figure 22: Figure 23: United States Carbon Monoxide (CO) Levels, 2015 - 2019 Figure 24: United States HEPA Air Purifier Market Share, By End Use, By Value, 2016-2026F Figure 25: United States HEPA Air Purifier Market Share, By Distribution Channel, By Value, 2016-2026F United States Imports of Machinery and Apparatus for Filtering or Purifying Gases, By Value (USD Million), 2015-2020 United States Exports of Machinery and Apparatus for Filtering or Purifying Gases, By Value (USD Million), 2015-2020 Figure 26: Figure 27: 6 © TechSci Research
List of Tables Title Air Coolers S. No. United States Estimated Number of New Cancer Cases of Respiratory System and Subsequent Deaths, 2020 Table 1: Table 2: United States Total Number of Hospitals, 2019 United States Estimated Number of New Cancer Cases of Respiratory System and Subsequent Deaths, Female, 2020 Table 3: Table 4: United States HEPA + Activated Carbon Air Purifiers Product Benchmarking, 2020 United States Estimated Number of New Cancer Cases of Respiratory System and Subsequent Deaths, Male, 2020 Table 5: Table 6: United States Pre-Filter + HEPA Air Purifiers Product Benchmarking, 2020 Table 7: United States Estimated New Cases for Lung & Bronchus Cancers by Most Affected States, 2020 Table 8: United States HEPA Air Purifiers Product Benchmarking, 2020 7 © TechSci Research
Scope of Report Product of Interest (POI): Air Purifiers Air Purifier is a device that cleans the polluted air and is capable of effectively removing bacteria, viruses and particulate matter present in the air. Air purifiers are different from air cleaners in their application, size, cost and area of purification. Based on filter type, the United states air purifier market can be segregated into HEPA, HEPA + Activated Carbon, Prefilter + HEPA, and others. Market Segmentation Year Range UNITED STATES AIR PURIFIERS MARKET UNITED STATES AIR PURIFIERS MARKET BY DISTRIBUTION CHANNEL BY FILTER TYPE HEPA • Direct/Institutional Sales • Review Period HEPA+ Activated Carbon • Offline Retail Sales • Prefilter + HEPA 2016 – 2019 • Online Retail Sales • Others • Base Year BY REGION 2020 West BY END USE • Estimated Year Midwest • Residential/Household • 2021 North East • Non-Residential/Commercial • South • Forecast Period 2022 – 2026 8 © TechSci Research
Research Methodology Data Analysis Market Profiling Data Data Developing list of Respondents Formulating Questionnaire Collection Validation The data was scrutinized using MS-Excel, statistical tools and internal proprietary database to obtain qualitative and quantitative insights about United States air purifiers market. Data obtained as a result of primary and secondary research was validated through rigorous triangulation. In order to conduct industry experts’ interviews, TechSci formulated a detailed discussion guide. In-depth secondary research was conducted to determine overall market size, segmental market size and top players in United States air purifiers market. List of industry players and industry specialists was developed. TechSci conducted interviews with industry experts and industry players for data collection and verification. Primary Research Desk Research Company Analysis ✓ ✓ Recent Developments Market Changing Aspects/Dynamics Government Policies Final Conclusion ✓ ✓ Market Participants Key Strengths ✓ Identifying Key Opinion Leaders Questionnaire Design In-depth Interviews Research & Intelligence Actionable Insights Data Collection Business Solution Data Filter & Analysis ✓ ✓ ✓ ✓ Primary Research Secondary Research Paid Sources LinkedIn TechSci Internal Database Company Websites Company Annual Reports White Paper Study Financial Reports Investor Presentations Regulatory Body Associations, etc. Factiva Hoovers ✓ ✓ ✓ ✓ ✓ ✓ ✓ ✓ ✓ ✓ ✓ 10 © TechSci Research
Research Methodology Baseline Methodology Our dedicated team of industry experts has monitored and analyzed various aspects of the United States air purifiers market. The team has analyzed the outlook of various segments of this market, while considering the major influencing factors, such as air pollution and growing awareness towards health and wellness. The study includes market forecasting, which would enable our clients to take better decisions while planning their strategy to achieve sustainability in the United States air purifiers market. Methodology Followed for Calculation of Market Size: Market size, in terms of value and volume, for the year 2020 was calculated based on information collected through exhaustive • secondary research and primary surveys, with various key opinion leaders/stakeholders, such as air purifier manufacturers, importers, suppliers, distributors and industry experts. The team interviewed more than 15 manufacturers/suppliers/importers, 20 distributors/retailers and 5 industry experts in the • United States air purifiers market to estimate the overall market size during 2016-2020, which was validated by the Delphi technique. Taking standard deviation into consideration, the market size was averaged out to arrive at the market size data for 2016-2020. Respondents were asked about the current and future market growth rates, market shares by filter type, by end use, by • distribution channel, by region and by company. Removing the outlier responses, the geometric mean of growth estimates and product wise revenue shares generated across various segments were considered, to arrive at the final revenue shares. Revenue shares generated across various segments were further triangulated from other stakeholders depending upon the type of air purifier. 11 © TechSci Research
Research Methodology Methodology Followed for Calculation of Market Shares: Market shares by filter type, by end use, by distribution channel, by region and by company were calculated based on the • responses received through primary surveys with industry experts, in which the respondents were asked about the market shares or revenue generated from various types of air purifiers. The final shares were calculated by taking the geometric mean of the responses gathered from key opinion leaders after eliminating the outliers. Methodology Followed for Forecasting: TechSci Research performed periodical checks on data collected through the surveys with logic checks and analyzed the survey • results in SPSS/Tableau Software. Data triangulation techniques were applied to fill the gaps and to present a more meaningful picture of the market. To forecast • the United States air purifiers market, TechSci Research used various forecast techniques such as: Moving Average ✓ Time Series Analysis ✓ Regression Analysis ✓ Econometric and Judgmental Analysis ✓ 12 © TechSci Research
Research Methodology TechSci Research used its own forecast tool, which is based on the growth of various allied industries in respective regions. TechSci Research also used the impact analysis during short, medium and long term period to estimate the demand and to reach accurate market numbers. It should be noted that the figures compiled are only for the organized market including market share data. The currency used in the report is the United States Dollar (USD), with the market size indicated in USD million. Partial List of Companies Interviewed Key Secondary Sources Austin Air Systems Ltd. World Bank ▪ ▪ IQAir North America, Inc. International Monetary Fund (IMF) ▪ ▪ Blueair Inc. TechSci Research Proprietary Database & Knowledge ▪ ▪ Honeywell International, Inc. Repository ▪ Whirlpool Corporation Company Annual Reports ▪ ▪ Alen Corporation Industry Magazines ▪ ▪ Sharp Electronics Corporation Industry Reports ▪ ▪ Rabbit Air News Dailies ▪ ▪ Winix America Inc. Credible Paid Databases ▪ ▪ Coway USA Inc. ▪ 13 © TechSci Research
Industry Brief According to TechSci Research report, “United States Air Purifier Market By Filter Type, By End Use, Competition Forecast & Opportunities, 2013 – 2023”, United States air purifier market is projected to surpass $ 3.9 billion by 2023, owing to increasing incidences of respiratory diseases, allergies and communicable infections. Rising concerns about indoor and outdoor air pollution, especially during winter season, in addition to growing awareness about air pollution causing lung diseases and cancer and its ramifications on cognitive abilities, are expected to aid the market growth. Moreover, growing employers’ concerns about the health of workers employed in industries and commercial sector are anticipated to propel the demand for air purifiers in the US during forecast period. Apart from alleviating volatile organic compounds (VOCs), toxic chemicals and smoke particles, air purifiers are being increasing used to remove pet dander, dust, pollen, mold spores and dust mite feces that trigger several allergies in sensitive people, at times leading to severe health related issues. In 2017, HEPA and activated carbon air purifiers accounted for the largest market share, as these purifiers have no side-effects on human health and provide highly efficient air purification with HEPA filters removing dust as well as particulate matters and activated carbon filters facilitating odor removal. South region of United States is the largest consumer of air purifiers in the country and is expected to maintain its market dominance through 2023, owing to high level emissions of volatile organic compounds (VOCs), Sulfur oxides and other toxic air pollutants including benzene from tobacco, petrochemical, aircraft and other heavy chemical industries and manufacturing units situated in Texas, Louisiana, Alabama and other states of the region. Health concerns due to increasing air pollution levels are on the rise across residential, commercial and industrial sectors. Air purifiers are being installed in schools, colleges, corporate offices, government buildings, embassies and other buildings to curb growing incidences of respiratory and pulmonary diseases. In addition to a growing assortment of functions, variety of sizes for air purifiers are also being introduced to cater to the requirements of commercial sector that holds the largest share in the US air purifier market. “United States air purifier market is expected to exhibit steady growth in the forthcoming years. Manufacturers and suppliers of air purifiers in the country are working on product development and introduction of technologically-advanced air purifiers such as Wi-Fi connectivity, etc. Moreover, they are taking initiatives to improve consumer knowledge about air purifiers and their available variants to generate a sustained year-round demand for such lifestyle-enhancing products rather than relying on sales spikes during adverse situations and specific seasons. With companies encouraging customers to choose products after careful evaluation and comparison of their characteristics, market players operating in the US are also focusing on improving the efficiency of their products and introduce air purifiers with higher air flow and Clean Air Delivery Rate (CADR).”, said Mr. Karan Chechi, Research Director with TechSci Research, a research based global management consulting firm. 14 © TechSci Research
Sample Data - Snapshot United States Air Purifiers Market Size, By Value (USD Million), By Volume (Thousand Units), 2016-2026F CAGR 2016-2020 By Value: xx% By Volume: xx% CAGR 2021E-2026F By Value: xx% By Volume: xx% 2016 2017 2018 2019 2020 2021E 2022F 2023F 2024F 2025F 2026F Value (USD Million) Volume (Thousand Units) United States HEPA + Activated Carbon Air Purifiers Market Share, By End Use, By Value, 2016-2026F 2021 E 2022 F 2023 F 2024 F 2025 F 2026 F 2016 2017 2018 2019 2020 Non-Residential/Commercial 40.00% 40.00% 40.00% 40.00% 40.00% 40.00% 40.00% 40.00% 40.00% 40.00% 40.00% Residential/Household 60.00% 60.00% 60.00% 60.00% 60.00% 60.00% 60.00% 60.00% 60.00% 60.00% 60.00% United States HEPA Air Purifiers Market Share, By Distribution Channel, By Value, 2016-2026F 2016 2017 2018 2019 2020 2021E 2022F 2023F 2024F 2025F 2026F Direct/Institutional Sales 20.00% 20.00% 20.00% 20.00% 20.00% 20.00% 20.00% 20.00% 20.00% 20.00% 20.00% Offline Retail Sales 30.00% 30.00% 30.00% 30.00% 30.00% 30.00% 30.00% 30.00% 30.00% 30.00% 30.00% Online Retail Sales 50.00% 50.00% 50.00% 50.00% 50.00% 50.00% 50.00% 50.00% 50.00% 50.00% 50.00% 15 © TechSci Research
Report Ordering Report Name: UNITED STATES AIR PURIFIERS MARKET FORECAST AND OPPORTUNITIES 2016 – 2026 Report Price License Type Price Electronic Access - Single User License $3450 Electronic Access - Multi-User License $4450 Custom Research License $8450 To View Sample OR Purchase Report 16 © TechSci Research
About Us & Disclaimer TechSci Research is a global market research and consulting company with offices in the US, UK and India. TechSci Research provides market research reports in number of areas to organizations. The company uses innovative business models that focus on improving productivity, while ensuring creation of high-quality reports. The proprietary forecasting models use various analyses of both industry-specific and macroeconomic variables on a state-by-state basis to produce a unique ‘bottom-up’ model of a country, regional and global industry prospects. Combined with the detailed analysis of company activity and industry trends, the result is a uniquely rich evaluation of the opportunities available in the market. Related Reports Global Air Purifiers Market By Filter Type (HEPA & Activated Carbon; HEPA, Activated Carbon and Ion & Ozone Generator; etc.), By End User (Industrial, Residential & Commercial), By Region, Competition Forecast & Opportunities, 2012-2022 • Australia Air Purifiers Market By Filter Type (HEPA, Ion & Ozone, Electrostatic Precipitators, HEPA +Activated Carbon, HEPA+ Activated Carbon + Ion Ozone and Others), By End Use (Residential, Commercial/Industrial), By Distribution Channel (Direct/Institutional Sales, Exclusive Brand Outlets, Multi-Branded Electronic Stores, Supermarkets/Hypermarkets and Online Channels), By Region, Competition Forecast and Opportunities, 2025 • TechSci Research – North America 708 Third Avenue, Manhattan, New York, United States Tel: +1- 646- 360- 1656 Email: sales@techsciresearch.com www.techsciresearch.com TechSci Research – Europe 54, Old brook, Bretton, Peterborough, United Kingdom Email: sales@techsciresearch.com www.techsciresearch.com TechSci Research – Asia-Pacific B – 44, Sector – 57, Noida, National Capital Region, U.P. - India Tel: +91-120-4523900 Email: sales@techsciresearch.com www.techsciresearch.com Disclaimer The contents of this report are based on information generally available to the public from sources believed to be reliable. No representation is made that it is timely, accurate or complete. TechSci Research has taken due care and caution in compilation of data as this has been obtained from various sources including which it considers reliable and first hand. However, TechSci Research does not guarantee the accuracy, adequacy or completeness of any information and it is not responsible for any errors or omissions or for the results obtained from the use of such information and especially states that it has no financial liability whatsoever to the subscribers / users of this report. The information herein, together with all estimates and forecasts, can change without notice. All the figures provided in this document are indicative of relative market size and are strictly for client’s internal consumption. Usage of the same for purpose other than internal will require prior approval of TechSci Research.