Download
1 / 20
200 likes | 203 Views
Growing environmental concerns because of diesel buses and increasing government initiatives for adoption of electric buses to drive the Asia Pacific Bus market through 2026. https://bit.ly/2XV8Ua6

E N D
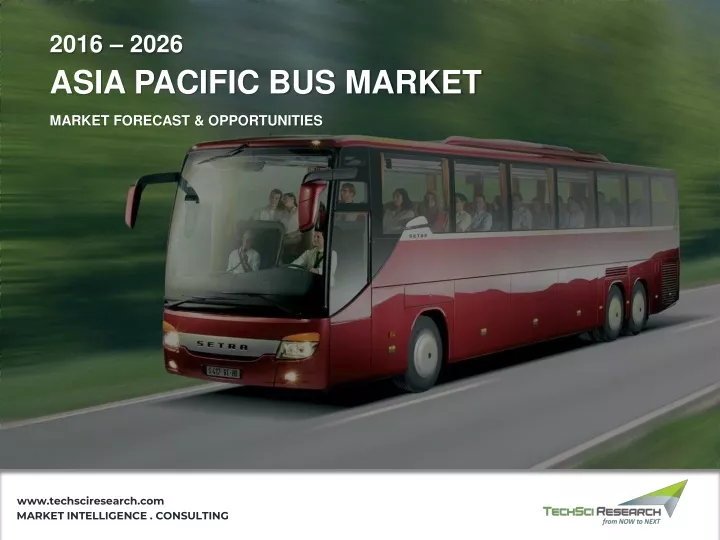
2016 – 2026 ASIA PACIFIC BUS MARKET MARKET FORECAST & OPPORTUNITIES www.techsciresearch.com MARKET INTELLIGENCE . CONSULTING
Scope of Report Product of Interest (POI): Bus An automotive bus or a motor bus is a road vehicle designed to carry a group of people, usually more than 15 passengers. It consists of long body design & specially arranged seats and is driven by an internal combustion engine or electric motor. Their length usually varies from 6 meters to 12 meters with seating capacity of more than 15 passengers. These automobiles are mostly used as motor coaches, for transit purposes and school buses. Market Segmentation Year Range COUNTRIES SEATING CAPACITY LENGTH TYPE Less than 30 Australia • • Less than 8m • Between 30-40 Singapore • • Review Period Between 8m-10m • Greater than 40 Thailand • • Between 10m-12m • 2016 – 2019 Taiwan • Greater than 12m • Malaysia • Base Year Japan • FUEL TYPE BODY TYPE 2020 New Zealand • Fully built • Diesel • Indonesia • Estimated Year Customizable • Electric & Hybrid • China • Petrol/Gasoline 2021 • India • CNG • APPLICATION Rest of APAC • Forecast Period Intra-City Bus • 2022 – 2026 Inter-City Bus • School Buses/Others • 2
Table of Contents S. No. Contents Page No. 1. Product Overview 2. Research Methodology 3. Executive Summary 4. Impact of COVID-19 on Asia-Pacific Bus Market 5. Voice of Customer 6. Asia-Pacific Bus Market Outlook Market Size & Forecast 6.1. 6.1.1. By Value & Volume 6.2. Market Share & Forecast By Length Type (Less than 8m, Between 8m-10m, Between 10m-12m, Greater than 12m) 6.2.1. 6.2.2. By Fuel Type (Diesel, Electric & Hybrid, Petrol/ Gasoline and CNG) 6.2.3. By Seating Capacity (Less than 30, Between 30-40, Greater than 40) 6.2.4. By Body Type (Fully built, Customizable) 6.2.5. By Application (Intra-City Bus, Inter-City Bus and School Buses/Others) By Country (Australia, Singapore, Thailand, Taiwan, Malaysia, Japan, New Zealand, and Indonesia) 6.2.6. 6.2.7. By Company (2020) Product Market Map 6.3. 3
Table of Contents S. No. Contents Page No. 7. Australia Bus Market Outlook Market Size & Forecast 7.1. 7.1.1. By Value & Volume 7.2. Market Share & Forecast 7.2.1. By Length Type 7.2.2. By Fuel Type 7.2.3. By Seating Capacity 7.2.4. By Body Type 7.2.5. By Application 8. Singapore Bus Market Outlook Market Size & Forecast 8.1. 8.1.1. By Value & Volume 8.2. Market Share & Forecast 8.2.1. By Length Type 8.2.2. By Fuel Type 8.2.3. By Seating Capacity 8.2.4. By Body Type 8.2.5. By Application 4
Table of Contents S. No. Contents Page No. 9. Thailand Bus Market Outlook Market Size & Forecast 9.1. 9.1.1. By Value & Volume 9.2. Market Share & Forecast 9.2.1. By Length Type 9.2.2. By Fuel Type 9.2.3. By Seating Capacity 9.2.4. By Body Type 9.2.5. By Application 10. Taiwan Bus Market Outlook Market Size & Forecast 10.1. 10.1.1. By Value & Volume Market Share & Forecast 10.2. 10.2.1. By Length Type 10.2.2. By Fuel Type 10.2.3. By Seating Capacity 10.2.4. By Body Type 10.2.5. By Application 5
Table of Contents S. No. Contents Page No. 11. Malaysia Bus Market Outlook Market Size & Forecast 11.1. 11.1.1. By Value & Volume Market Share & Forecast 11.2. 11.2.1. By Length Type 11.2.2. By Fuel Type 11.2.3. By Seating Capacity 11.2.4. By Body Type 11.2.5. By Application 12. Japan Bus Market Outlook Market Size & Forecast 12.1. 12.1.1. By Value & Volume Market Share & Forecast 12.2. 12.2.1. By Length Type 12.2.2. By Fuel Type 12.2.3. By Seating Capacity 12.2.4. By Body Type 12.2.5. By Application 6
Table of Contents S. No. Contents Page No. 13. New Zealand Bus Market Outlook Market Size & Forecast 13.1. 13.1.1. By Value & Volume Market Share & Forecast 13.2. 13.2.1. By Length Type 13.2.2. By Fuel Type 13.2.3. By Seating Capacity 13.2.4. By Body Type 13.2.5. By Application 14. Indonesia Bus Market Outlook Market Size & Forecast 14.1. 14.1.1. By Value & Volume Market Share & Forecast 14.2. 14.2.1. By Length Type 14.2.2. By Fuel Type 14.2.3. By Seating Capacity 14.2.4. By Body Type 14.2.5. By Application 7
Table of Contents S. No. Contents Page No. 15. China Bus Market Outlook Market Size & Forecast 15.1. 15.1.1. By Value & Volume Market Share & Forecast 15.2. 15.2.1. By Length Type 15.2.2. By Fuel Type 15.2.3. By Seating Capacity 15.2.4. By Body Type 15.2.5. By Application 16. India Bus Market Outlook Market Size & Forecast 16.1. 16.1.1. By Value & Volume Market Share & Forecast 16.2. 16.2.1. By Length Type 16.2.2. By Fuel Type 16.2.3. By Seating Capacity 16.2.4. By Body Type 16.2.5. By Application 8
Table of Contents S. No. Contents Page No. 17. Rest of APAC Bus Market Outlook Market Size & Forecast 17.1. 17.1.1. By Value & Volume Market Share & Forecast 17.2. 17.2.1. By Length Type 17.2.2. By Fuel Type 17.2.3. By Seating Capacity 17.2.4. By Body Type 17.2.5. By Application 18. Market Dynamics Drivers 18.1. Challenges 18.2. 19. Market Trends & Developments 20. Competitive Landscape 20.1. Competition Outlook 20.2. Company Profiles (Leading 10 Companies) 9
Table of Contents S. No. Contents Page No. 20.2.1. Company Details 20.2.2. Products & Services 20.2.3. Financials (As Reported) 20.2.4. Key Market Focus & Geographical Presence 20.2.5. Recent Developments 20.2.6. Key Management Personnel 21. Strategic Recommendations 22. About us & Disclaimer 10
RESEARCH RESEARCH METHODOLOGY METHODOLOGY
Research Methodology Market Profiling Data Analysis Data Data Developing list of respondents Formulating Questionnaire Collection Validation In-depth secondary research was conducted to determine top players in the Asia Pacific bus market, overall market size and segmental market size. The data was scrutinized using MS-Excel, statistical tools and internal proprietary database to obtain qualitative and quantitative insights about the Asia Pacific bus market Data obtained as a result of primary and secondary research was validated through rigorous triangulation. TechSci conducted interviews with industry experts and industry players for data collection and verification. In order to conduct industry experts’ interviews, TechSci formulated a detailed discussion guide. List of industry players and industry specialists was developed. Primary Research Desk Research Company Analysis ✓ ✓ Recent Developments Market Changing Aspects/Dynamics Government Policies Final Conclusion ✓ ✓ Market Participants Key Strengths ✓ Identifying Key Opinion Leaders Questionnaire Design In-depth Interviews Actionable Insights Data Filter & Analysis Business Solution Research & Intelligence Data Collection ✓ ✓ ✓ ✓ Primary Research Secondary Research Paid Sources LinkedIn TechSci Internal Database Company Website Company Annual Reports White Paper Study Financial Reports Investor Presentations Regulatory Body Associations, etc. Factiva Hoovers ✓ ✓ ✓ ✓ ✓ ✓ ✓ ✓ ✓ ✓ ✓ 12
Research Methodology Baseline Methodology Our dedicated team of industry experts has monitored and analyzed various aspects of Asia Pacific bus market. The team has analyzed the outlook of various segments of this market, while considering the major influencing factors such as stringent government regulations for the safety of occupant etc. and speculated a positive growth during the next 5 years. The study includes market forecasting, which would enable our clients to take better decisions while planning their strategy to achieve sustainability in Asia Pacific bus market. Methodology Followed for Calculation of Market Size: Market Size by Value & Volume: Market size, in terms of value & volume, for the year 2020 was calculated based on information collected • through exhaustive secondary research and primary surveys, with various key opinion leaders/stakeholders, such as bus supplier companies, channel partners, market influencers & end users, industry experts, and other industry participants. The team interviewed more than 15 – 20 bus supplier companies, 45 – 50 channel partners, 80 – 100 end users, and 15 – 20 Industry experts • and other Value & Volume chain stakeholders in Asia Pacific bus market to obtain the overall market size from 2016-2020, which was validated by the Delphi technique. Taking standard deviation into consideration, the market size was averaged out, to arrive at the market size data from 2016-2020. 13
Research Methodology Respondents were asked about the current and future market growth rates, market shares by length type, by fuel type, seating capacity, by • body type, by application, by country and by company. Removing the outlier responses, the geometric mean of growth estimates and supplier wise revenue shares generated across various segments were considered, to arrive at the final revenue shares. Revenue shares generated across various segments were further triangulated from other stakeholders depending upon the end use product type of bus. Methodology Followed for Calculation of Market Shares: Market shares shares by length type, by fuel type, seating capacity, by body type, by application, by country and by company were calculated based on the responses received through primary surveys with industry experts, in which the respondents were asked about the market shares or revenue generated from various end use product type of bus. The final shares were calculated by taking the geometric mean of the responses gathered from key opinion leaders after eliminating the outliers. Methodology Followed for Forecasting: TechSci Research performed periodical checks on data collected through the surveys with logic checks and analyzed the survey results in • SPSS/Tableau Software. Data triangulation techniques were applied to fill the gaps and to present a more meaningful picture of the market. To forecast Asia Pacific • bus market, TechSci Research used various forecast techniques such as: Moving Average ✓ Time Series Analysis ✓ Regression Analysis ✓ Econometric and Judgmental Analysis ✓ 14
Research Methodology TechSci Research used its own forecast tool, which is based on the growth of various allied industries in respective regions. TechSci Research also used the impact analysis during short, medium and long term period to estimate the demand and to reach accurate market numbers. It should be noted that the figures compiled are only for the organized market including market share data. Partial List of Companies Interviewed Key Secondary Sources Toyota Motor Corporation. Society of Indian Automobile Manufacturers ▪ ▪ SML Isuzu Ltd. Organisation Internationale des Constructeurs ▪ ▪ Hino Motors, Ltd. d'Automobiles ▪ AB Volvo Automobile Association of India ▪ ▪ Scania AB Japan Automobile Manufacturers Association ▪ ▪ MAN SE World Bank ▪ ▪ Daimler AG TechSci Research Proprietary Database & Knowledge ▪ ▪ Nissan Motor Company, Ltd. Repository ▪ Mitsubishi Fuso Truck and Bus Corporation Company Annual Reports ▪ ▪ Shanghai Shenlong Bus Co., Ltd. Industry Magazines ▪ ▪ Industry Reports ▪ News Dailies ▪ Credible Paid Databases ▪ 15
Research Methodology Currency Exchange Rates • The currency used in the report is the United States Dollar (USD), with the market size indicated in USD million. The company revenues were taken from their annual reports. • Average annual currency conversion rate was used for companies that reported their revenue in other currencies. • Source: US Forex, The Bureau of the Fiscal Service and US Department of Treasury Country 2016 2015 2016 2019 2020 United States (USD) 1 1 1 1 1 India (INR) 61.01 64.12 610.18 65.11 68.41 China (Yuan) 6.16 6.28 6.64 6.76 6.62 Bangladesh (Bangladeshi Taka) 76.2613 76.4603 76.6326 77.6070 82.8187 Indonesia ( Indonesian Rupiah) 12,165.5 12,391.6 13,736.3 13,513.5 13,506.3 Sri Lanka (Sri Lanka Rupee) 130.675 131.111 140.930 146.980 153.282 Vietnam (Vietnamese Dong) 20,930.1 21,129.2 22,019.7 22,468 22,674 16
Industry Brief According to TechSci Research report, “Asia Pacific Bus Market By Length Type (Less than 8m, Between 8m-10m, Between 10m-12m, Greater than 12m), By Fuel Type (Diesel, Petrol/Gasoline, Gas, Electric, Hybrid), By Seating Capacity (Less than 30, Between 30-40, Greater than 40), By Body Type (Fully Built, Customizable), By Application (Transit Bus, School Bus/Others, Motorcoaches), By Country, Competition, Forecast & Opportunities, 2026”, Asia Pacific Bus market is anticipated to reach 42.57 thousand units by 2026 because of growing environmental concerns about diesel buses, which emit a lot of pollution that is harmful to people's health and the environment, as well as increasing government measures to encourage the use of electric buses. Due to increasing fleet of personal two-wheelers and four-wheeler vehicles on roads, the level of pollution is increasing day by day which is a huge concern. Not only this, increasing fleet of personal vehicles is affecting the environment and also leading to traffic congestion which is creating lots of issues for the daily travellers on the roads. To overcome the issue of environmental pollution and traffic congestion governments are taking necessary steps like promoting buses for daily travelling by decreasing subsidies on buses and benefits for increasing the adoption rate of electric vehicles and replacing heavy-duty diesel and gasoline-run buses with zero-emission electric buses. Electric buses have the potential to significantly reduce pollution levels because no gases will escape from the vehicle and produce pollution. However, because more people will opt to commute by bus as a result of increased bus services, these buses will also help to reduce traffic congestion. However, the deployment of electric buses will depend upon country wise policy and also the number of charging stations in respective countries. To run the electric buses on roads, countries should have a strong charging infrastructure to avoid problems. Asia Pacific Bus market can be segmented on the basis of length, by fuel type, by seating capacity, by body type and by application. Based on length type, less than 8m buses is leading the market. But in 2020, the sales of buses with length 10m-12m increased because of their for intracity and intercity application. In by fuel type, diesel buses are dominating the market with over 90% market share in 2020. In the forecast period also, it is expected that diesel buses will dominate the bus market, but electric buses segment is expected to grow at a CAGR of 24.18% in comparison to diesel buses. In by seating capacity segment, the buses with below 30 seats are leading the market because of their high demand for intracity purposes. In by body type segment, the fully built buses are dominating the Asia pacific bus market and in forecast period also they are expected to dominate the market. In by application type bus segment, transit buses are leading the market because of their high demand as intracity buses and followed by motorcoaches. The demand for motorcoaches buses is also more because such buses are used mainly as intercity buses and also for the sightseeing purpose. Major players operating in Asia Pacific Bus market are Toyota Motor Corporation, SML Isuzu Ltd., Hino Motors, Ltd. etc., are among some of the leading players operating in Asia Pacific Bus market. Apart from these companies, AB Volvo, MAN, Daimler AG, Nissan and Mitsubishi Fuso Truck and Bus Corporation are key players, who are developing advanced technologies and launching new products to stay competitive in the market. Other competitive strategies adopted by market players include mergers and acquisition, new product developments and increasing their marketing activities and enriching product portfolio globally to increase their customer outreach. “In 2020, Japan accounted for the largest share i.e., 40.63% in Asia Pacific Bus market and it is expected to dominate in the forecast period also. Japan is leading the Asia Pacific Bus market because of increasing tourism and awareness among people regarding using buses”, said Mr. Karan Chechi, Research Director with TechSci Research, a research based global management consulting firm. 17
Sample Data - Snapshot Asia Pacific Bus Market Size, By Value (USD Million) & Volume (Thousand Units), 2016–2026F (USD Million) 15.00 110.00 14.00 100.00 13.00 90.00 12.00 80.00 11.00 70.00 10.00 60.00 9.00 50.00 8.00 40.00 7.00 30.00 6.00 20.00 5.00 10.00 CAGR BY Value & Volume XX% CAGR BY Value & Volume YY% 2016 2020 By Value (USD Million) 2021E 2026F By Volume (Thousand Units) Asia Pacific Bus Market Share, By Length Type, By Volume, 2016–2026F Less than 8m Between 8m-10m Between 10m-12m Greater than 12m 25% 25% 25% 25% 2026F 25% 25% 25% 25% 2025F 25% 25% 25% 25% 2024F 25% 25% 25% 25% 2023F 25% 25% 25% 25% 2022F 25% 25% 25% 25% 2021E 25% 25% 25% 25% 2020 25% 25% 25% 25% 2019 25% 25% 25% 25% 2018 25% 25% 25% 25% 2017 25% 25% 25% 25% 2016 Australia Bus Market Share, By Fuel Type, By Volume, 2016–2026F Diesel Electric & Hybrid Petrol/Gasoline CNG 25% 25% 25% 25% 2026F 25% 25% 25% 25% 2025F 25% 25% 25% 25% 2024F 25% 25% 25% 25% 2023F 25% 25% 25% 25% 2022F 25% 25% 25% 25% 2021E 25% 25% 25% 25% 2020 25% 25% 25% 25% 2019 25% 25% 25% 25% 2018 25% 25% 25% 25% 2017 25% 25% 25% 25% 2016 18
Competitor Profile Report Name: ASIA PACIFIC BUS MARKET MARKET FORECAST & OPPORTUNITIES 2016 – 2026 License Type Single User License Price $4900 Multi-User License Custom Research License $5900 $8900 To View Sample OR Purchase Report 19
About Us & Disclaimer TechSci Research is a global market research and consulting company with offices in the US, UK and India. TechSci Research provides market research reports in number of areas to organizations. The company uses innovative business models that focus on improving productivity, while ensuring creation of high-quality reports. The proprietary forecasting models use various analyses of both industry-specific and macroeconomic variables on a state-by-state basis to produce a unique ‘bottom-up’ model of a country, regional and global industry prospects. Combined with the detailed analysis of company activity and industry trends, the result is a uniquely rich evaluation of the opportunities available in the market. Related Reports Global Tractor Market By Power Output (Under 40 HP, 40 HP - Under 100 HP and 100 HP & Above), By Drive Type (Two-Wheel Drive & Four- Wheel Drive), By Application (Agriculture & Non-Agriculture), By Region, Competition Forecast & Opportunities, 2016-2026 • United States OTR Tire Market, By Application Type (Construction, Agriculture, Mining, Material Handling, Ports, Forestry and Others), By Demand Category (Replacement, OEM), By Rim Size (Upto 25’’, Above 25”), By Tire Construction (Bias, Radial), By Region, Competition Forecast & Opportunities, 2026 • TechSci Research – North America 708 Third Avenue, Manhattan, New York, United States Tel: +1- 646- 360- 1656 Email: sales@techsciresearch.com www.techsciresearch.com TechSci Research – Europe 54, Old brook, Bretton, Peterborough, United Kingdom Email: sales@techsciresearch.com www.techsciresearch.com TechSci Research – Asia-Pacific B – 44, Sector – 57, Noida, National Capital Region, U.P. - India Tel: +91-120-4523900 Email: sales@techsciresearch.com www.techsciresearch.com Disclaimer The contents of this report are based on information generally available to the public from sources believed to be reliable. No representation is made that it is timely, accurate or complete. TechSci Research has taken due care and caution in compilation of data as this has been obtained from various sources including which it considers reliable and first hand. However, TechSci Research does not guarantee the accuracy, adequacy or completeness of any information and it is not responsible for any errors or omissions or for the results obtained from the use of such information and especially states that it has no financial liability whatsoever to the subscribers / users of this report. The information herein, together with all estimates and forecasts, can change without notice. All the figures provided in this document are indicative of relative market size and are strictly for client’s internal consumption. Usage of the same for purpose other than internal will require prior approval of TechSci Research.