Download
1 / 11
110 likes | 114 Views
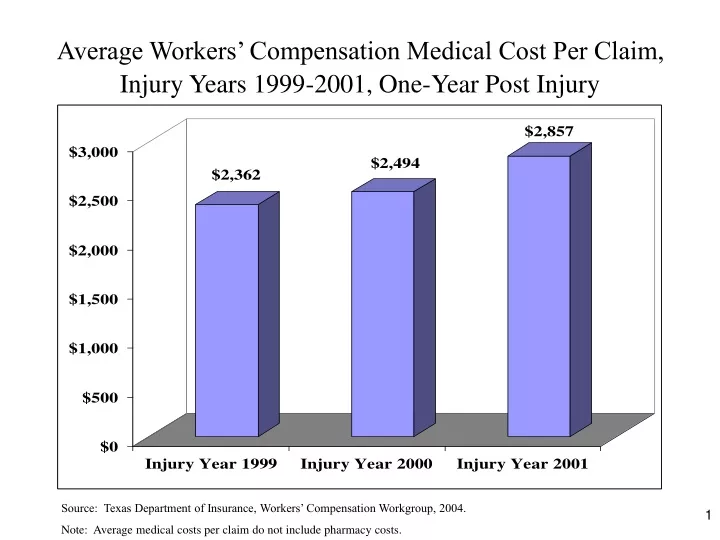
Average Workers’ Compensation Medical Cost Per Claim, Injury Years 1999-2001, One-Year Post Injury. Source: Texas Department of Insurance, Workers’ Compensation Workgroup, 2004. Note: Average medical costs per claim do not include pharmacy costs.

E N D
Average Workers’ Compensation Medical Cost Per Claim, Injury Years 1999-2001, One-Year Post Injury Source: Texas Department of Insurance, Workers’ Compensation Workgroup, 2004. Note: Average medical costs per claim do not include pharmacy costs.
Distribution of Total Workers’ Compensation Medical Costs by Injury Type – Injury Years 1999-2001, One-Year Post Injury Source: Texas Department of Insurance, Workers’ Compensation Workgroup, 2004.
Distribution of Total Workers’ Compensation Medical Costs by Injury Type – Injury Year 2000, One-Year Post Injury Source: Texas Department of Insurance, Workers’ Compensation Workgroup, 2004. Note: Total medical payments do not include pharmacy costs.
Distribution of Total Workers’ Compensation Medical Costs by Provider Type – Service Years 1999-2001 Source: Texas Workers’ Compensation Commission, System Data Report: Data as of December 2003, 2004 and the Texas Department of Insurance, Workers’ Compensation Workgroup, 2004.
Distribution of Total Workers’ Compensation Medical Costs by Provider Type – Service Years 1999-2001(percentages in parentheses) Source: Texas Workers’ Compensation Commission, System Data Report: Data as of December 2003, 2004 and the Texas Department of Insurance, Workers’ Compensation Workgroup, 2004. Note: Total medical costs do not include pharmacy costs,
Percentage of Health Care Providers That Account for a Majority of Non-Hospital Medical Costs, Injury Years 1999-2001, One Year Post Injury(actual # of providers in parentheses) Source: Texas Department of Insurance, Workers’ Compensation Workgroup, 2004.
Distribution of Health Care Providers That Account for 50 Percent of Non-Hospital Medical Costs, Injury Year 2000, One Year Post Injury Source: Texas Department of Insurance, Workers’ Compensation Workgroup, 2004.
Average Number of Physical Medicine Treatments Per Injured Worker Who Received These Treatments, Injury Years 1999-2001, One-Year Post Injury Source: Texas Department of Insurance, Workers’ Compensation Workgroup, 2004.
Average Number of Physical Medicine Treatments Per Visit, Injury Years 1999-2001, One-Year Post Injury Source: Texas Department of Insurance, Workers’ Compensation Workgroup, 2004.
Average Number of Physical Medicine Visits Per Worker, Injury Years 1999-2001, One-Year Post Injury Source: Texas Department of Insurance, Workers’ Compensation Workgroup, 2004.
Median Number of PhysicalMedicine Treatments per Injured Worker with Low Back Soft Tissue Injuries, Injury Year 2000, One-Year Post Injury Source: Research and Oversight Council on Workers’ Compensation, 2002 and 2003.