Exploring Conic Sections
Make a table of values. Plot the points and connect them with a smooth curve. x y –4 0 –3 ± 7 ± 2.6 –2 ± 2 3 ± 3.5 –1 ± 15 ± 3.9 0 ±4 1 ± 15 ± 3.9 2 ± 2 3 ± 3.5

Exploring Conic Sections
E N D
Presentation Transcript
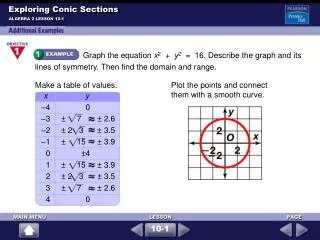
Make a table of values. Plot the points and connect them with a smooth curve. xy –4 0 –3 ± 7 ± 2.6 –2 ± 2 3 ± 3.5 –1 ± 15 ± 3.9 0 ±4 1 ± 15 ± 3.9 2 ± 2 3 ± 3.5 3 ± 7 ± 2.6 4 0 Exploring Conic Sections ALGEBRA 2 LESSON 10-1 Graph the equation x2 + y2 = 16. Describe the graph and its lines of symmetry. Then find the domain and range. 10-1
< < < < – – – – Recall from Chapter 2 that you can use set notation to describe a domain or a range. In this Example, the domain is {x| –4 x 4}. The range is {y| –4 y 4}. Exploring Conic Sections ALGEBRA 2 LESSON 10-1 (continued) The graph is a circle of radius 4. Its center is at the origin. Every line through the center is a line of symmetry. 10-1
< < < < – – – – Make a table of values. Plot the points and connect them with smooth curves. xy –2 0 –1 ± 2.6 0 ± 3 1 ± 2.6 2 0 The domain is {x| –2 x 2}. The range is {y| –3 y 3}. Exploring Conic Sections ALGEBRA 2 LESSON 10-1 Graph the equation 9x2 + 4y2 = 36. Describe the graph and the lines of symmetry. Then find the domain and range. The graph is an ellipse. The center is at the origin. It has two lines of symmetry, the x-axis and the y-axis. 10-1
Make a table of values. Plot the points and connect them with smooth curves. xy –5 ± 4.6 –4 ± 3.5 –3 ± 2.2 –2 0 –1 — 0 — 1 — 2 0 3 ± 2.2 4 ± 3.5 5 ± 4.6 Exploring Conic Sections ALGEBRA 2 LESSON 10-1 Graph the equation x2 – y2 = 4. Describe the graph and its lines of symmetry. Then find the domain and range. 10-1
< – > – The domain is {x| x –2 or x 2}. The range is all real numbers. Exploring Conic Sections ALGEBRA 2 LESSON 10-1 (continued) The graph is a hyperbola that consists of two branches. Its center is at the origin. It has two lines of symmetry, the x-axis and the y-axis. 10-1
< < < < – – – – The domain is {x| –5 x 5}. The range is {y| –4 y 4}. Exploring Conic Sections ALGEBRA 2 LESSON 10-1 Identify the center and intercepts of the conic section. Then find the domain and range. The center of the ellipse is (0, 0). The x-intercepts are (–5, 0) and (5, 0), and the y-intercepts are (0, –4) and (0, 4). 10-1
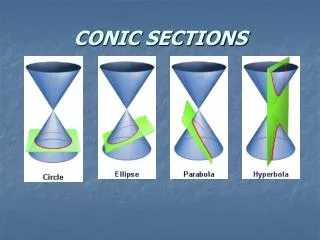
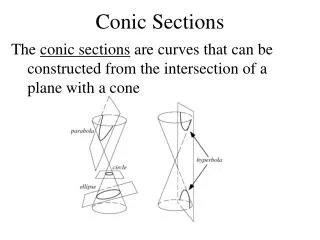
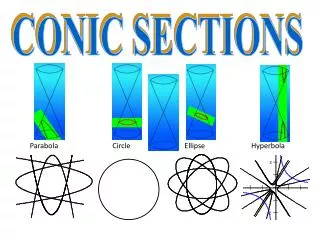
Exploring Conic Sections ALGEBRA 2 LESSON 10-1 Describe each Moiré pattern as a circle, an ellipse, or a hyperbola. Match it with one of these possible equations, 2x2 – y2 = 16, 25x2 + 4y2 = 100, or x2 + y2 = 16. a.b.c. a. The equation 25x2 + 4y2 = 100 represents a conic section with two sets of intercepts, (±2, 0) and (0, ±5). Since the intercepts are not equidistant from the center, the equation models an ellipse. 10-1
c. The equation 2x2 – y2 = 16 represents a conic section with one set of intercepts, (±2 2, 0), so the equation must be a hyperbola. Exploring Conic Sections ALGEBRA 2 LESSON 10-1 (continued) a.b.c. b. The equation x2 + y2 = 16 represents a conic section with two sets of intercepts, (±4, 0) and (0, ±4). Since each intercept is 4 units from the center, the equation models a circle. 10-1