Download
1 / 27
270 likes | 358 Views
This study explores the impact of nitrogen balance from agricultural activities in Greece. Using GIS and statistical data, it analyzes nitrogen input and output to assess environmental risks. The project details methodology, data sources, results, and conclusions. The innovative methodology provides accurate insights using reliable statistical data, ensuring international standards compliance.

E N D
NATIONAL STATISTICAL SERVICE OF GREECE «Agri-environmental indicators: Nitrogen balance at NUTS IV level. A case study in Greece »
«Agri-environmental indicators: Nitrogen balance at NUTS IV level. A case study in Greece » • Introduction • Methodology • Data Sources • Results • Conclusions
Introduction Objective of the project: The aim of this project was to introduce an analytical tool using Geographical Information System and statistical data available from existing surveys (Farm Structure Surveys and the Agricultural Census) in order to measure the impact of agricultural activities to the rural environment. The study focused on the nitrogen balance from agricultural activities, at LAU1 level, as an indicator of the risk posed to the environment from excessive nitrogen. The LAU1 analysis of the Nitrogen balance made in order to identify areas of high surpluses and thus where surface and ground water may be at risk.
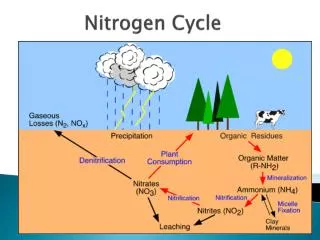
METHODOLOGY of N BALANCE ESTIMATION The nitrogen balance provides useful information regarding the state of nitrogen surpluses. Nitrogen Balance = N input – N output = N held by the soil + N removal from the soil.
Inorganic fertilizers Animal manure Nitrogen of leguminous crops Atmospheric deposition Nitrogen input Nitrogen balance Agricultural land Plant production Grass and fodder crop production Nitrogen output METHODOLOGY of N BALANCE ESTIMATION Terms of the soil surface Nitrogen balance
DATA SOURCES The data sources were used in the context of this project were: a. Farm Structure Survey: Statistical data on cultivated areas by kind of crop and on number of animals at LAU1 were derived from the Basic Surveys of the year 1991 and 1999/2000 b. Annual Agricultural Statistical Survey:Statistical data on cropyield by kind of crop at LAU1 level were derived from a national survey using administrative sources. c. The Greek map of Land Cover /use, based on the Corine Land cover project: File consisting of 16 categories of land cover. These data originated from processing of satellite images and the CORINE program. This file was used mainly for estimation of nitrogen absorbed by pastures from animal grazing. d. Natura areas: This was a GIS file of natura areas which is a complementary one, and gives to the users the ability to overlay all the other information with that of sensitive areas.
Annual Agricultural Statistical Survey File (national level)
Data Base Construction The above files have been organized and processed into a uniform application of GIS with spatial level of reference the LAU1. In this way it is possible to produce maps of the profile of each prefecture (NUTS III) as well as of the country for input, output and nitrogen balance of the agricultural areas of the country. The following data were used to set up the database: • Statistical data from the records of the National Statistical Service of Greece. *.xls , *.sav format. • Local administrative boundaries from 1991 up to the implementation of Law 2539/97 (Kapodistrias scheme). Polygonal – Linear Database. *.shp format • Biophysical land cover (CORINE LAND COVER) scale 1:100.000. Polygonal Database. *.shp format • Types of habitat (NATURA). Polygonal Database. *.shp format
RESULTS • Estimation of Nitrogen balance input from crops production. • Estimation of Nitrogen input from livestock manure. • Estimation of the fixation by leguminous crops and clover. • Estimation of the Nitrogen deposition to agricultural land • Estimation of the the nitrogen absorption from harvested crops • Nitrogen balance
Estimation of Nitrogen input from mineral fertilisers.
Estimation of Nitrogen input from livestock manure.
Nitrogen balance for Greece, 1997 according to J. Hansen methodology
Nitrogen balance estimates for Greece, 1991 according to M. Terres et al methodology
CONCLUSIONS The proposed methodology : • Is innovative • Uses low level of NUTS IV calculation so the provided analysis is sufficient for all policy implementations • Is based on error free guaranteed statistical data • Estimation and coefficient applied are of international standards