Download
1 / 36
370 likes | 583 Views
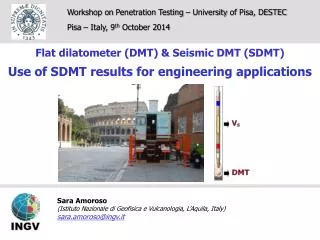
Workshop on Penetration Testing – University of Pisa, DESTEC Pisa – Italy, 9 th October 2014. Flat dilatometer (DMT) & Seismic DMT (SDMT). Use of SDMT results for engineering applications. Sara Amoroso (Istituto Nazionale di Geofisica e Vulcanologia, L’Aquila, Italy)

E N D
Workshop on PenetrationTesting – Universityof Pisa, DESTEC Pisa – Italy, 9th October 2014 Flat dilatometer (DMT) & Seismic DMT (SDMT) Use of SDMT results for engineering applications Sara Amoroso (Istituto Nazionale di Geofisica e Vulcanologia, L’Aquila, Italy) sara.amoroso@ingv.it
Outline of the presentation Flat dilatometer (DMT) Seismic dilatometer (SDMT) Interpretation of the parameters Engineering applications
DMT Flatdilatometerequipment BLADE FLEXIBLE MEMBRANE(D = 60mm)
DMT Test layout & components Pneumatic – electric cable Pneumatic cable Control box Push force Gas tank Push rods DMT blade p0 Lift-off pressure p1 Pressure for 1.1 mm expansion Measurements performed after penetration independent from insertion method
DMT insertion with penetrometer Most efficient method: direct push with penetrometer
A B DMT Workingprinciple Sensing disk (electrically insulated) Retaining Ring Membrane Sensing disk Blade is like an electrical switch, can be off or on NO ELECTRONICS no zero drift, no temperature effects Nothing that the operator can regulate, adjust, manipulate
DMT Intermediate parameters DMT Readings Intermediate Parameters Id: Material Index P0 Kd: Horizontal Stress Index P1 Ed: Dilatometer Modulus
(p0 - u0) KD = σ’v KD contains information on stress history DMT formula similar to K0: (p0 – u0) σ’h KD is an “amplified” K0, because p0 is an “amplified” σh due to penetration p0 Very roughly KD ≈ 4K0 E.g. in NC K0 ≈ 0.5 and KD ≈ 2 KD well correlated to OCR and K0 (clay)
Intermediate Parameters Id Ed Kd DMT Formulae – Interpretedparameters Interpreted Parameters M: Constrained Modulus Cu: Undrained Shear Strength Ko: Earth Pressure Coeff (clay) OCR: Overconsolidation ratio (clay) : Safe floor friction angle (sand) : Unit weight and description
KDcorrelatedto OCR (clay) 1.56 Marchetti 1980 (experimental) OCR = 0.5 Kd Theoretical Finno 1993 Experimental Kamei & Iwasaki 1995 Theoretical Yu 2004
Cu correlation from OCRLadd SHANSEP 77 (SOA TOKYO) Ladd: best Cu measurement not from TRX UU !! Cu Cu best Cu from oed OCR Shansep = OCR m σ’v σ’v OC NC 1.56 OCR = 0.5 Kd Using m 0.8 (Ladd 1977) and (Cu/’v)NC 0.22 (Mesri 1975) 1.25 Kd Cu σ’v 0.22 0.5 =
DMT Formulae (1980 – today) Po and P1 Intermediate parameters Interpreted parameters
DMT results KD=2NCclay ID MCu KD soiltype (clay, silt, sand) common use shapesimilartoOCR helpsunderstandhistoryofdeposit Generally dependable
Seismic Dilatometer (SDMT) Combination S+DMT 2 receivers VS determined from delay arrival of impulse from 1st to 2nd receiver (same hammer blow) Signal amplified + digitized at depth VS measured every 0.5m DMT Marchetti 1980 SDMT Hepton 1988 ASTM D6635 – EC7 Martin & Mayne 1997,1998 ... TC16 2001
Example seismograms SDMT at Fucino Delay well conditioned from Cross Correlation coeff of variation of Vs 1-2 %
High repeatability SDMT results GO= ρ Vs2 DMT Seismic DMT
Vs at National Site FUCINO –ITALY SDMT (2004) SCPT Cross Hole SASW AGI (1991) Fucino-Telespazio National Research Site (Italy) 2004 20
Standards EUROCODE 7 (1997 and 2007). Standard Test Method, European Committee for Standardization, Part 2: Ground investigation and testing, Section 4. Field tests in soil and rock. 4.10. Flat Dilatometer Test (DMT). ASTM (2002 and 2007). Standard Test Method D6635-01, American Society for Testing and Materials. The standard test method for performing the Flat Dilatometer Test (DMT), 14 pp. TC16 (1997). “The DMT in soil Investigations”, a report by the ISSMGE Technical Committee tc16 on Ground Property, Characterization from in-situ testing, 41 pp. PROTEZIONE CIVILE Gruppo di lavoro (2008) – Indirizzi e criteri per la microzonazione sismica. Prova DMT pp. 391-397, Prova SDMT pp. 397-405 ASTM (2011) – Standard Test Method D7400 – 08, “Standard Test Methods for Downhole Seismic Testing“, 11 pp. Consiglio Superiore dei Lavori Pubblici (2008) –Istruzioni per l'applicazione Norme Tecniche per le Costruzioni NTC08. Circolare 02/02/09 , paragrafo C6.2.2
Experimental interrelationship between G0 and MDMT • Data points tend to group according to soil type (ID) • G0/MDMT constant, varies in wide range(≈ 0.5 to 20), especially in clay • G0/MDMT largely influenced by stress history (KD) • By-product rough estimates of VS (when not measured) SDMT data from 34 sites Ratio G0/MDMT vs. KD for various soil types (Marchetti et al. 2008, Monaco et al. 2009) MDMT, ID, KD (DMT) G0VS
Experimental interrelationship between G0 and MDMT • COMMENTS • Use of cu (or NSPT) alone as a substitute of VS(when not measured) for seismic classification of a site (Eurocode 8) does not appear founded on a firm basis • If VS assumed as primary parameter for site classification, then a possible surrogate must be reasonably correlated to VS … But if 3 parameters (MDMT, ID, KD) barely sufficient to obtain rough estimates of VS, then estimating VS from only 1 parameter appears problematic …
Estimates of VS from DMT data Comparison of profiles of VSmeasured by SDMT and estimated from mechanical DMT data (Monaco et al. 2013)
Vs prediction from CPT and DMT • DMT predictions of VS appear more reliable and consistent than the CPT predictions (Amoroso 2014) • VS from DMT includes KD , sensitive to stress history, prestraining/aging and structure, scarcely detected by qc
Main SDMT applications • Settlements of shallow foundations • Compaction control • Slip surface detection in OC clay • Quantify σ'hrelaxation behind a landslide • Laterally loaded piles • Diaphragm walls • FEM input parameters • Liquefiability evaluation • In situ G-γ decay curves • …
Tentative method for deriving in situ G- decay curves from SDMT SDMT small strainmodulusG0 from VS working strainmodulusGDMTfrom MDMT (track record DMT-predicted vs. measured settlements) ? But which associated to GDMT ?
Shear strain "DMT" • Quantitative indicationsbycomparing at various test sites and in differentsoiltypesSDMT data + “reference” stiffness decay curves: • back-figured from the observed behavior under a full-scale test embankment (Treporti) or footings (Texas) • obtained by laboratory tests (L'Aquila, Emilia Romagna, Fucino) • reconstructed by combining different in situ/laboratory techniques (Western Australia) same-depth "reference" stiffness decay curve
Typical ranges of DMT in different soil types "Typical shape" G/G0- curves in different soil types (Amoroso, Monaco, Lehane, Marchetti – Paper under review) Range of values of GDMT/G0 and corresponding shear strain DMT determined by the "intersection" procedure in different soil types
Tentative equation for deriving G/G0- curves from SDMT SDMT data points used to assist construction of hyperbolic equation Roio Piano – L'Aquila Comparison between G/G0- decay curves obtained in Lab and estimated from SDMT by hyperbolic equation DSDSS (Double Sample Direct Simple Shear tests): University of Roma La Sapienza (Amoroso, Monaco, Lehane, Marchetti – Paper under review)
Validation of in situ G- decay curves from SDMT (under study) • Comparison between HSS model – PLAXIS from SDMT parameters and monitoring activities for the excavation of Verge de Montserrat Station (Barcelona, Spain) Working group: Amoroso, Arroyo, Gens, Monaco, Di Mariano
Validation of in situ G- decay curves from SDMT (under study) HSS model – PLAXIS G/G0 = 0.722 Assumptions: γ0.7
Validation of in situ G- decay curves from SDMT (under study) • Preliminary results show an acceptable agreement between experimental data (monitoring activities) and numerical analysis (based on SDMT data) Phase 9 “Pumping down to a depth of 10 m”
Concludingremarks • At sites where VS has not been measured and only mechanical DMT results from past investigations are available, rough estimates of VS (via G0) can be obtained from mechanical DMT data • SDMT results could be used to assess the decay of in situ stiffness with strain level and to provide guidance in selecting G- curves in various soil types, thanks to its ability to provide both a small strain modulus (G0 from VS) and a working strain modulus GDMT (obtained from MDMT derived by usual DMT interpretation) • Use of proposed hyperbolic relationship, which requires to input ratio GDMT/G0 + presumed "typical" shear strain DMT for a given soil type, can provide a useful first order estimate of G/G0- curves from SDMT (further validation needed)