Scatter Plots & Linear Regression
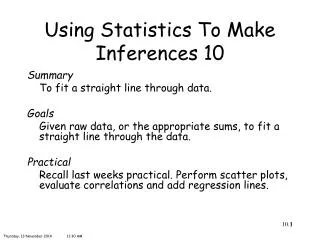
Scatter Plots & Linear Regression. Scatter Plots. Graph of a set of data points Used to evaluate the correlation between two variables. Regression Line. The line of best fit - a straight line that best represents the data on a scatter plot.

Scatter Plots & Linear Regression
E N D
Presentation Transcript
Scatter Plots • Graph of a set of data points • Used to evaluate the correlation between two variables
Regression Line The line of best fit -a straight line that best represents the data on a scatter plot. This line may pass through some of the points, none of the points, or all of the points.
Correlation Coefficient, r r measures the strength and direction of the relationship between 2 variables -1≤ r ≤1 A correlation greater than 0.8 is generally described as strong, whereas a correlation less than 0.5 is generally described as weak.
Positive Correlation • r is positive • As x increases, y also increases • If x and y have a strong positive linear correlation, r is close to 1
Negative Correlation • r is negative • As x increases, y decreases • If x and y have a strong negative linear correlation, r is close to -1
No correlation • random, nonlinear relationship between the two variables • Points show no pattern • r is near zero
Perfect Correlations Form Straight Lines correlation coefficient, r = 1 correlation coefficient, r = -1
IMPORTANT Correlation does not prove causation!!!