Albrecht Poglitsch, MPE Garching
470 likes | 662 Views
FIRST Photodetector Array Camera & Spectrometer (PACS). Albrecht Poglitsch, MPE Garching. Science Requirements. Basis for PACS design Main scientific drivers Investigations of the distant universe: galaxy formation and evolution - history of star formation and nuclear activity

Albrecht Poglitsch, MPE Garching
E N D
Presentation Transcript
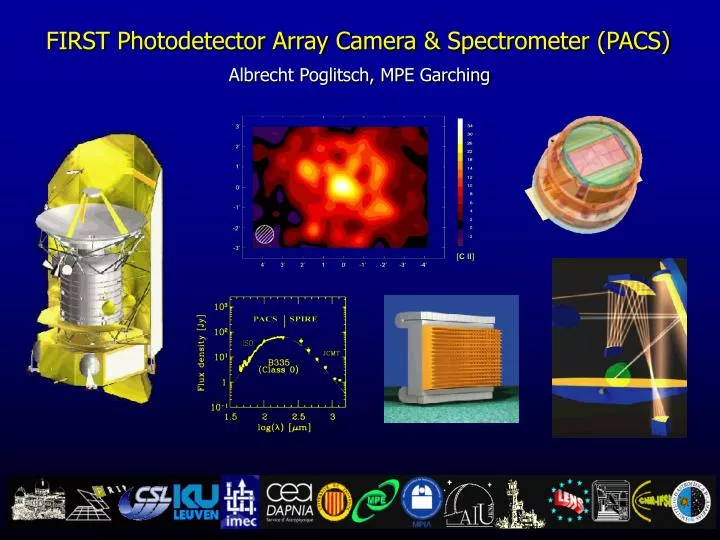
FIRST Photodetector Array Camera & Spectrometer (PACS) Albrecht Poglitsch, MPE Garching PACS Instrument
Science Requirements • Basis for PACS design • Main scientific drivers • Investigations of the distant universe: galaxy formation and evolution - history of star formation and nuclear activity • Studies of star formation and the origin of the Initial Mass Function in our own Galaxy • Physics and chemistry of the interstellar medium, Galactic and extragalactic • Giant planets and the history of the Solar System • Required observing capabilities • Imaging photometry in 3 bands in the 60 - 210µm range with requirements on sensitivity per detector and field of view • Imaging line spectroscopy in the 60 - 210µm (goal: 55 - 210µm) range with requirements on sensitivity per detector, spectral resolution and instantaneous bandwidth, and field of view PACS Instrument
PACS In A Nutshell Focal Plane Footprint • Imaging photometry • two bands simultaneously (60-90 or 90-130 µm and 130-210 µm) with dichroic beam splitter • two filled bolometer arrays (32x16 and 64x32 pixels, full beam sampling) • point source detection limit ~3 mJy (5s, 1h) • Integral field line spectroscopy • range 57 - 210 µm with 5x5 pixels, image slicer, and long-slit grating spectrograph (R ~ 1500) • two 16x25 Ge:Ga photoconductor arrays (stressed/unstressed) • point source detection limit 2…8 x10-18 W/m2 (5s, 1h) PACS Instrument
3.5 x 3.0 arcmin2 0.78 x 0.78 arcmin2 PACS Design: Focal Plane Footprint PACS Instrument
Definition of the FOV for the Photometer Physical pixel size: 0.75 x 0.75 mm2 PACS Instrument
Pixel scale has to be a compromise • small number of spatial pixels limits field of view • diffraction introduced by image slicer does not allow full sampling • large wavelength range requires compromise • Physical optics analysis shows that 9.4”/pixel gives low enough diffraction losses (15% at 175 µm) with acceptable spatial resolution/ • Full spatial sampling in the long-slightly offset pointings wave band with two, Definition of the FOV for the Spectrometer • Pixel scale has to be a compromise • small number of spatial pixels limits field of view • diffraction introduced by image slicer does not allow full sampling • large wavelength range requires compromise • Physical optics analysis shows that 9.4”/pixel gives low enough diffraction losses (15% at 175 µm) with acceptable spatial resolution/ 47” sampling PACS Instrument
PACS Integral Field Line Spectrometer • Optical “image slicer” re-arranges 2-D field of view (5x5 pixels) along 1-D slit (1x25 pixels) • Grating spectrograph disperses light • Dispersed slit image is projected on 2-D detector array • 16 spectral channels recorded simultaneously for each spatial element PACS Instrument
PACS FPU PACS Instrument
PACS FPU PACS Instrument
PACS FPU PACS Instrument
PACS FPU PACS Instrument
PACS FPU PACS Instrument
PACS FPU PACS Instrument
PACS FPU PACS Instrument
PACS FPU PACS Instrument
PACS FPU PACS Instrument
PACS FPU PACS Instrument
PACS FPU Photometer Optics Filter Wheel I Slicer Optics Blue Bolometer 0.3 K Cooler Red Bolometer Grating Grating Drive Encoder sGe:GaDetector Red Spectrometer Spectrometer Optics Chopper Black Body I and II Filter Wheel II Calibrator Optics sGe:Ga Detector Blue Spectrometer Entrance Optics PACS Instrument
Aberrations of full optical train (telescope + PACS) included • Strehl ratio 0.99 • Distortion < 1 pixel • Strehl ratio >0.95 • Distortion < 1 pixel Photometer Image Quality PACS Instrument
PACS Spectrometer Diffraction Analysis re-imaged telescope focus “slice” through point spread function entrance slit field mirror capture mirror detector array grating pixel Spectrometer Image Quality Center of Array, center l Distortion in spatial direction: ~0.1 pixel Corner of Array, extreme l PACS Instrument
PACS Ge:Ga Photoconductor Arrays 16 pixel stressed detector module • 16x25 pixel filled arrays • 25 linear modules • integrated cryogenic readout electronics Feed optics: light cone array PACS Instrument
NEP vs. bias NEP [W/Hz] T=1.7K, P=9x10-14W, tint=1 s, Cint=10 pF Wavelength (µm) PACS Photoconductor Modules • Ge:Ga photoconductors • unstressed: 40 - 120µm • stressed: 110 - 210µm • background-limited in both, photometry and spectroscopy,if amplifier noise is low enough PACS Instrument
Sync Detectors CA1 CA2 CA18 Reset Sample Analog Bus Switch Control Logic Clock 18-Bit Shift Register PACS Cryogenic Readout Electronics In Cf • Capacitive feedback transimpedance amplifier (CTIA) for each pixel, based on AC-coupled inverter stage in silicon CMOS technology • 16 CTIAs multiplexed on each CRE chip for each linear detector module • CRE chips integrated in detector modules • Amplifier noise compatible with background-limited performance in spectroscopy -A Out CAC CTIA architecture PACS Instrument
Support 300 mKfilter Mechanical interface Ribbon cable 300 mK 2 K buffer amplifiers Strap 300 mK (top view) (bottom view) Bolometer Array Assembly PACS Instrument
pixel efficiency will be integrated in the interconnection circuit in next models I/C 1 Multiplexer I/C 2 MOS Followers -Mechanical suspension -Thermal link to the substrate -Electrical connection Pixel Interconnection circuit with reflectors Bolometer Arrays: 16x16 Subarray PACS Instrument
10-16W/Hz1/2 Bolometer Readout & Performance PACS Instrument
100 ms PACS Grating • Diamond ruled reflection grating • Optical size 320 x 80 mm • Used in 1st, 2nd, and 3rd order, angle range 48° ± 20° • 1st order (red detector) 210 - 105 µm • 2nd order (blue detector) 105 - 72 µm • 3rd order (blue detector) 72 - 55 µm • Groove profile optimized for highest efficiency over all 3 orders using PCgrate full EM-code • Cryogenic torquer motor drive • Inductosyn angular resolver Grating efficiency (above) and resolution (below) PACS Instrument
PACS Chopper • Chopper with variable throw and arbitrary waveform used for spatial modulation and for observation of internal calibration sources • Electromagnetic linear drive • Monolithic flexural pivots • Magnetoresistive position sensors • Duty cycle > 80% PACS Instrument
Instrument Units and Subsystem Responsibilities PACS Instrument
Observing Modes • Observing modes are combinations of instrument modes and satellite pointing modes • Instrument modes: • dual-band photometry • single-band photometry • line spectroscopy • range spectroscopy • Pointing modes: • stare/raster/line scan • with/without nodding PACS Instrument
Dual-Band Photometry • Both arrays operating • full spatial sampling in each band • long-wave array imaging 130-210µm band • short-wave array imaging 60-90 or 90-130µm band • sub-band selected by filter • Standard mode for PACS as prime instrument • Observing parameters • chopper mode (off/on; waveform, throw) • pointing parameters (stare/raster/scan;nod) • integration time per pointing PACS Instrument
Single-Band Photometry • One array operating • long-wave array imaging 130-210µm bandor • short-wave array imaging 60-90 or 90-130µm band • Standard mode for PACS/SPIRE parallel mode • Observing parameters • chopper mode (off/on; waveform, throw) • pointing parameters (stare/raster/scan;nod) • integration time per pointing PACS Instrument
Line Spectroscopy • One or two arrays operating • observation of individual lines • long-wave array in 105-210µm band • short-wave array in 57-72 or 72-105µm band • wavelength in primary band determines wavelength in secondary band • Observing parameters • scan width (default 0) • chopper mode (off/on; waveform, throw) • pointing parameters (stare/raster/scan;nod) • integration time per pointing PACS Instrument
Range Spectroscopy • Two arrays operating • observation of extended wavelength ranges • continuous scan (full resolution) or steps (SED sampling) • long-wave array in 105-210µm band • short-wave array in 57-72 or 72-105µm band • Observing parameters • start- and end wavelength • resolution mode • chopper mode (off/on; waveform, throw) • pointing parameters (stare/raster/scan;nod) • integration time per pointing PACS Instrument
Parameters of PACS Instrument Model (a) Values for the photometry modes from 60-90 / 90-130 µm and 130-210 µm, respectively. (b) The formal transmission of >1 takes into account the acceptance solid angle of the light cones / bolometer pixels which differs from the beam solid angle. PACS Instrument
Sensitivity (spectroscopy) detection limit (5s, 1h) [10-18 W/m2] detection limit (5s, 1h) [mJy] Sensitivity (photometry) wavelength [µm] wavelength [µm] FIRST/PACS 5s confusion limit PACS Sensitivity PACS Instrument
Deep extragalactic surveys Simulated deep PACS survey of 10-5sr at 75, 110, 170 µm (false colors) to a 1 limit of 0.7, 0.7, 0.5 mJy. Such a survey will need ~40 hours • Characterize the obscured part of high redshift star and galaxy formation, especially in the range z~1-3 where most star formation happened and most metals formed. • Resolve the cosmic FIR background • Multiwavelength information essential for starburst/AGN discrimination and redshift indication. • PACS spatial resolution crucial to beat confusion and for identification. • Photometric/spectroscopic followup. • Example: A 1000 hour dual-band PACS survey to 5 depths of 10mJy at 110m and 170m will cover ~15 square degrees and detect tens of thousands of galaxies. [arcmin] 0 2 4 6 8 10 0 2 4 6 8 10 [arcmin] PACS Instrument
IMF in cores and clusters Serpens core – PACS 100 m simulation 0.08 M, 5 limit – 2 hours map, 2 hours SED photometry • Understanding the origin of the stellar mass distribution • Efficient mapping of large areas to get good statistics • Good SED coverage including maximum to get accurate masses/luminosities • Probing down to equivalent brown dwarf masses • Individual cores observable in few hours • 3-band survey to the same limit for 6 star forming regions within 500pc (total 12 sq. degree): ~500 hours PACS Instrument
Spatially resolved study of the ISM in galaxies • What is the nature and distribution of the various gas and dust phases? • How do these vary in galaxies of different types and metallicity? • What are the heating/cooling mechanisms and the relation to energy sources (star formation / AGN)? • Observations: Deep FIR imaging and spectroscopic mapping of galaxies • Time: Several hours for broad-band imaging and spectroscopic mapping in [CII] / [OI] of a nearby large galaxy like M83. • Spatial resolution decisive in separating nuclei / arms / interarms / star forming complexes M31 175m: Haas et al. 1998 PACS Instrument
Stellar mass loss Y CVn ISOHOT 90µm: Izumiura et al. 1997 • Establish mass loss history through high resolution imaging of dust shells • Determine physical and chemical conditions in the inner circumstellar envelopes, through PACS spectroscopy of the important coolants CO, HCN, and H2O, and of various other species participating in the initial chemistry of the escaping gas. W Hya ISO-LWS: Barlow et al. 1996 PACS Instrument
HD • Estimate baryon density – ratio D/H • HD observable from solar system to galaxies • Survey of 18 Galactic PDRs within 1.1kpc. Integration times for spectra between 1min and 4h, total 28 hours Wright et al. (1999) PACS Instrument
The PACS Consortium · PI Albrecht Poglitsch MPE Garching, Germany · Co-PI Christoffel Waelkens KU Leuven, Belgium Co-I´s : · Austria: Franz Kerschbaum UVIE Wien · Belgium: Chris van Hoof IMEC Leuven Rik Huygen KU Leuven Claude Jamar CSL Liège · France: Suzanne Madden Louis Rodriguez CEA Saclay Marc Sauvage Hervé Wozniak OAMP Marseille PACS Instrument
· Germany: Otto H. Bauer Helmut Feuchtgruber Reinhard Genzel Reinhard Katterloher MPE Garching Dieter Lutz Eckhard Sturm Linda Tacconi Ulrich Klaas MPIA Heidelberg Dietrich Lemke Thomas Henning AIU Jena · Italy: Paola Andreani OAP Padova Paolo Saraceno IFSI Roma Gianni Tofani OAA Arcetri · Spain: Jordi Cepa IAC Tenerife PACS Instrument