Analysis of Cell-Type Adjusted P-Values in Cross-Sectional and Longitudinal Studies
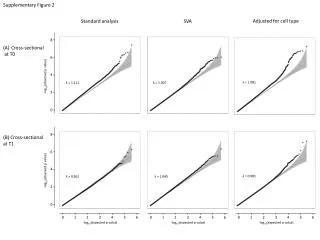
This figure illustrates the adjusted observed and expected p-values across different time points (T0 and T1) and study designs (cross-sectional and longitudinal). For T0, the lambda values were 1.081, 1.111, and 1.007, while for T1, they were 0.981, 0.962, and 1.040. The -log10 scale is used for both observed and expected p-values, facilitating comparison. The longitudinal data, with a lambda of 1.023, is also presented, showing the intra-class correlation (ICC) for more comprehensive insights into the effects of cell type adjustments.

Analysis of Cell-Type Adjusted P-Values in Cross-Sectional and Longitudinal Studies
E N D
Presentation Transcript
Supplementary Figure 2 Adjusted for cell type Standard analysis SVA Cross-sectional at T0 λ = 1.081 λ = 1.111 λ = 1.007 (B) Cross-sectional at T1 λ = 0.981 λ = 0.962 λ = 1.040 8 8 6 6 4 4 -log10(observed p value) -log10(observed p value) 2 2 0 0 0 0 0 1 1 1 2 2 2 3 3 3 4 4 4 5 5 5 6 6 6 -log10(expected p value) -log10(expected p value) -log10(expected p value)
Standard analysis (C) Longitudinal λ = 1.023 8 6 4 -log10(observed p value) 2 0 0 1 2 3 4 5 6 -log10(expected p value)
(D) Cross-sectional at T0 (E) Cross-sectional at T1 (F) Longitudinal 1 0 ICC