Introduction to Six Sigma
Introduction to Six Sigma . Dr. Lotfi K. Gaafar The American University in Cairo. Performance Reliability Durability Serviceability. Aesthetics Features Perceived Quality Conformance to standards. Dimensions of Quality. Quality means fitness for use - quality of design

Introduction to Six Sigma
E N D
Presentation Transcript
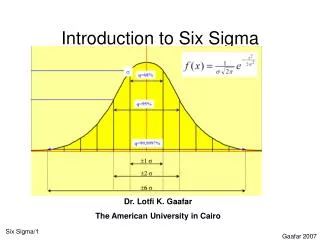
Introduction to Six Sigma Dr. Lotfi K. Gaafar The American University in Cairo Gaafar 2007
Performance Reliability Durability Serviceability Aesthetics Features Perceived Quality Conformance to standards Dimensions of Quality Quality means fitness for use - quality of design - quality of conformance Quality is inversely proportional to variability. Gaafar 2007
Quality Characteristics • Physical - length, weight, voltage, viscosity • Sensory - taste, appearance, color • Time Orientation - reliability, durability, serviceability • Specifications • Quality characteristics being measured are often compared to standards or specifications. • Nominal or target value • Upper Specification Limit (USL) • Lower Specification Limit (LSL) Gaafar 2007
Quality and Variability Quality improvement requires the reduction of variability in processes and products Sources of variability: • Processes • People • Equipment • Surroundings • Materials • Measurement Gaafar 2007
What is Six Sigma? Six Sigma is a rigorous, focused and highly effective implementation of proven quality principles and techniques. Incorporating elements from the work of many quality pioneers, Six Sigma aims for virtually error free business performance. Sigma, s, is a letter in the Greek alphabet used by statisticians to measure the variability in any process. A company's performance is measured by the sigma level of their business processes. Traditionally companies accepted three or four sigma performance levels as the norm, despite the fact that these processes created between 6,200 and 67,000 problems per million errors (opportunities)! The Six Sigma standard of 3.4 problems per million opportunities is a response to the increasing expectations of customers and the increased complexity of modern products and processes. Source: http://www.pyzdek.com/six-sigma-revolution.htm Gaafar 2007
Six Sigma? DMAIC = Define-Measure-Analyze-Improve-Control. Source: http://www.pyzdek.com/six-sigma-revolution.htm Gaafar 2007
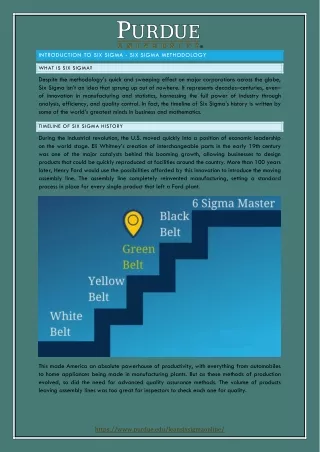
Deployment • Six Sigma is deployed by individuals certified in the methodology including: • Green Belt - certified to participate in the process • Black Belt - certified to lead Six Sigma projects • Master Black Belt - certified to train and certify others Gaafar 2007 Source: Lynn Cavanaugh, lynn.c.cavanaugh@wellsfargo.com
Six Sigma Methods • DMAIC • Define, Measure, Analyze, Improve, Control • Used to improve existing processes • DMADV / DFSS (DESIGN FOR SIX SIGMA) • Define, Measure, Analyze, Design, Verify • Used to develop new processes or implement new technologies • May be referred to as DFSS • Process Management • Reviewing and analyzing an entire work process from end to end (BPR) Gaafar 2007 Source: Lynn Cavanaugh, lynn.c.cavanaugh@wellsfargo.com
DMAIC and Project Management Gaafar 2007 Source: Lynn Cavanaugh, lynn.c.cavanaugh@wellsfargo.com
The Training Pyramid Course Six Sigma Title Basic White Belts Medium Green Belts Comprehensive Black Belts Executive Champions Executive Believer Gaafar 2007
The Training Pyramid Rank Main Role Employees Supervisors Managers In-house Experts Task improvement Lead small IPs Lead major, cross-functional IPs Train, provide expertise Gaafar 2007
Why Six Sigma succeeds? • ‘Real’ top management commitment • Goals with identical improvement rates • Common quality measurement techniques • Common language throughout the organization • Systematic training • Goal-directed incentives for people Gaafar 2007
Case Study: General Electric Top Management Commitment at GE (1996) • Clear Goal: Reach Six Sigma by year 2000. • Resources: Commit $450 million in 1996 and 1997 to: • train 5,000 executives and managers • train 80,000 engineers and other employees • Promotion: Six sigma training is a requirement for any advancement in GE Gaafar 2007
Case Study: General Electric Bottom-line and Other Results at GE (1998) • Revenues rose 11% • Earnings increased 13% • Increased investment in intellectual capital • More dedication from employees to take on new challenges Gaafar 2007
Case Study: General Electric • Compensation: GE ties 40% of bonus compensation for managers to the intensity of their efforts and measurable progress toward Six Sigma in their operations • Promotion: GE’s ranks of GMs, directors, and vice presidents are full of Black Belts who proved their worth to GE Gaafar 2007
Case Study: General Electric • Recognition: Verbal and written acknowledgement is the highest motivator. • Permission to fail: Mistakes are tools for personal and organizational growth. Gaafar 2007
Case Study: General Electric We’ve selected our “Champions” – senior managers who define the projects. We’ve trained 200 ‘Master Black Belts’ – full-time teachers with heavy quantitative skills as well as teaching and leadership ability. We’ve selected and trained 800 ‘Black Belts’ – full-time quality executives who lead teams and focus on key processes. And we have, at our Leadership Development Institute at Crotonville and at our businesses an unmatched educational capability to train all 222,000 GE people at Six Sigma Methodology. John F. Welch, CEO, 1996 Gaafar 2007
Six Sigma: Common Quality Tools • Pareto analysis • Root-cause analysis • Statistical process control • Design of experiments Gaafar 2007
The Normal Distribution Gaafar 2007
The Normal Distribution Gaafar 2007
The Normal Distribution For a population that is normally distributed: • approx. 68% of the data will lie within 1 standard deviation of the mean; • approx. 95% of the data will lie within 2 standard deviations of the mean, and • approx. 99.7% of the data will lie within 3 standard deviations of the mean. Gaafar 2007
The Normal Distribution The Standard Normal Distribution Excel functions: NORMDIST(x,mean,standard_dev,cumulative) NORMINV(probability,mean,standard_dev) NORMSDIST(z) NORMSINV(probability) Excel Simulation Gaafar 2007
Quality Improvement • Quality improvementis the reduction of variability in processes and products. Alternatively, quality improvementis also seen as “waste reduction”. • Effective quality improvement can be instrumental in increasing productivity and reducing cost. • The cost of achieving quality improvements and increased productivity is often negligible (quality is free). Gaafar 2007
The Normal Distribution Example The tensile strength of paper is modeled by a normal distribution with a mean of 35 lbs/in2 and a standard deviation of 2 lbs/in2. • What is the probability that the tensile strength of a sample is less than 40 lbs/in2? • If the specifications require the tensile strength to exceed 30 lbs/in2, what proportion of the samples is scrapped? Gaafar 2007
The Normal Distribution Examples In a production facility, the thickness of a sheet is normally distributed with a mean of 2.02 mm and a standard of 0.02 mm. The specifications on the sheet are 2.00±0.05 mm. What proportion of sheets will be rejected? Suggest a way to reduce the rejects. • The sick-leave time of employees in a firm in a month is normally distributed with a mean of 100 hours and a standard deviation of 20 hours. • What is the probability that the sick-leave time for next month will be between 50 and 80 hours? • How much time should be budgeted for sick leave if the budgeted amount should be exceeded with a probability of only 10%? Gaafar 2007
Product Specification and Process Variation • Product specification • desired range of product attribute • part of product design • length, weight, thickness, color, ... • nominal specification • upper and lower specification limits • Process variability • inherent variation in processes • limits what can actually be achieved • defines and limits process capability • Process may not be capable of meeting specification! Gaafar 2007
Process Capability Process variation LSL Spec USL • Capable process • Very capable process • Process not capable Gaafar 2007
Process Capability Index I • Measure of capability of process to meet (fall within) specification limits • Take “width” of process variation as 6 • If 6 < (USL - LSL), then at least 99.7% of output of process will fall within specification limits Spec LSL USL 6 99.7% 3 Gaafar 2007
Process Capability Index II Define Process Capability Index Cp as • If Cp ≥ 1.0, process is... capable • If Cp < 1.0, process is... not capable Gaafar 2007
Process Capability -- Example A manufacturer of granola bars has a weight specification 2 ounces plus or minus 0.05 ounces. If the standard deviation of the bar-making machine is 0.02 ounces, is the process capable? • USL = 2 + 0.05 = 2.05 ounces • LSL = 2 - 0.05 = 1.95 ounces • Cp = (USL - LSL) / 6 • = (2.05 - 1.95) / 6(0.02) • = 0.1 / 0.12 • = 0.85 Therefore, the process is not capable! Gaafar 2007
Process Centering LSL Spec USL • Capable and centered Capable but not centered • Capable but not centered Gaafar 2007
LSL=1.95 2.0 USL=2.05 Process Centering -- Example For the granola bar manufacturer, if the process is incorrectly centered at 2.05 instead of 2.00 ounces, what fraction of bars will be out of specification? Out of spec! 50% of production will be out of specification! Gaafar 2007
Gaafar 2007 Source: http://www.isixsigma.com/library/content/c030721a.asp
Suggested Reading • Breyfogle, F.W., III, Cupello, J.M., & Meadows, B. (2003). Managing Six Sigma: A Practical Guide to Understanding, Assessing, and Implementing the Strategy that Yields Bottom-Line Success. New York, New York: John Wiley & Sons. • Eckes, George. (2001) The Six Sigma Revolution: How General Electric and Others Turned Process into Profits. New York, New York: John Wiley & Sons. • Eckes, George. (2003) Six Sigma for Everyone. New York, New York: John Wiley & Sons. • Foster, S. Thomas. (2004). Managing Quality: An Integrative Approach. Upper Saddle River, New Jersey: Pearson Prentice Hall. • Kerzner, Harold. (2003). Project Management: a systems approach to planning, scheduling, and controling. Upper Saddle River, New Jersey: Pearson Prentice Hall. • Kinicki, A, & Kreitner, R. (2003). Organizational Behavior: key concepts, skills & best practices. New York, New York: McGraw Hill. • Pande, P.S., Neuman, R.P., & Cavanagh, R.R. (2000). The Six Sigma Way: How GE, Motorola and other Top Companies are Honing Their Performance. New York, New York: McGraw Hill. Gaafar 2007 Source: Christopher J. Zampogna, Boise State University