
Warm up
Warm up. Find the solutions. Find the interval of decrease. (-1, 0) (5, 0). x > 2. GPS Algebra. EQ How do we find the rate of change of a function and the average rate of change?. Rate of Change.

Warm up
E N D
Presentation Transcript
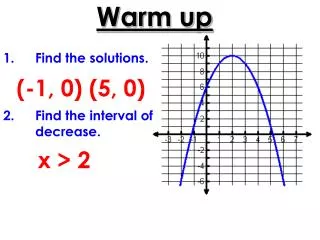
Warm up • Find the solutions. • Find the interval of decrease. (-1, 0) (5, 0) x > 2
GPS Algebra EQ How do we find the rate of change of a function and the average rate of change?
Rate of Change • The rate of change is the ratio of the change of one quantity to a change in another quantity.
Constant Rate of Change • The slope of a nonvertical line is the ratio of the vertical change (rise) to the horizontal change (run) between any two points on the line.
3.5 = 14– 7 = 4– 2 7 = 2 ANSWER The rate of change in cost is $3.50 per hour. EXAMPLE 1 Find a rate of change INTERNET CAFE The table shows the cost of using a computer at an Internet cafe for a given amount of time. Find the rate of change in cost with respect to time.
2. EXERCISE The table shows the distance a person walks for exercise. Find the rate of change in distance with respect to time. ANSWER 0.05 mi/min GUIDED PRACTICE
Constant Rate of Change Example 3 Rate of change between (2, 4) and (4, 8). m = 2
Rate of Change Example 4 The table shows the amount of water evaporating from a swimming pool on a hot day. Find the rate of change in gallons with respect to time. m = 2.25
Rate of Change 5. Where is the greatest (steepest) rate of change on the graph? What is the value? m = -7/2
Average Rate of Change(no graph) You will have to plug in the x-value in order to find the y-value to get the ordered pairs.
Example 6 Find the average rate of change of f(x) = 2x2 – 3 when x1= 2 and x2 = 4.
Example 7 Find the average rate of change of f(x) = x3 – 3x when x1= -2 and x2 = 0.
8. Calculate the Average Rate of Change y = x2 + 2 given 6 ≤ x ≤ 8 m = 14
9. Calculate the Average Rate of Change y = 3x2 + x – 5 given -1 ≤ x ≤ 1 m = 1
10. Calculate the Average Rate of Change y = ½x2 – 1 given 2 ≤ x ≤ 4 m = 3
11. Find the average rate of change of f(x) = x2 – 2 when x1= -3 and x2 = 4. m = 1
12. Calculate the Average Rate of Change y = 2x2 + 5 given 1 ≤ x ≤ 3 m = 8
Average Rate of Change(with a graph) Given a graph, locate on the graph the ordered pair that has the corresponding x-value.
13. Find the Average Rate of Change -3 ≤ x ≤ -2 m = -7
14. Find the Average Rate of Change 2 ≤ x ≤ 4 m = -3
15. Find the Average Rate of Change 6 ≤ x ≤ 8 m = 9/2
16. Find the average rate of change of the graph below when x1= -6 and x2 = -2. m = -2
17. Find the average rate of change of the graph below when x1= 0 and x2 = 2. m = -3/2
Walking Task • To begin a class discussion of speed, Dwain and Beth want to stage a walking race down the school hallway. After some experimentation with a stop watch, and using the fact that the flooring tiles measure 1 foot by 1 foot, they decide that the distance of the race should be 40 feet and that they will need about 10 seconds to go 40 feet at a walking pace. • They decide that the race should end in a tie, so that it will be exciting to watch, and finally they make a table showing how their positions will vary over time. Your job is to help Dwain and Beth make sure that they know how they should walk in order to match their plans as closely as possible.
The Data Draw a graph. Should you connect the dots?
Beth (blue)Dwain (Purple) Describe how Dwain and Beth should walk in order to match their data.
Beth (blue)Dwain (Purple) What is Beth and Dwain’s average speed from 0 to 3 seconds?
Beth (blue)Dwain (Purple) What is Beth and Dwain’s average speed from 6 to 8 seconds?
Beth (blue)Dwain (Purple) What is Beth and Dwain’s average speed from 0 to 10 seconds?


