
PM09
PM10. PM11. PM09. PM13. PM14. PM12. PM16. PM17. PM15. PM19. PM20. PM18. Supplemental Figure S1. Goh et al.

PM09
E N D
Presentation Transcript
PM10 PM11 PM09 PM13 PM14 PM12 PM16 PM17 PM15 PM19 PM20 PM18 Supplemental Figure S1. Goh et al.
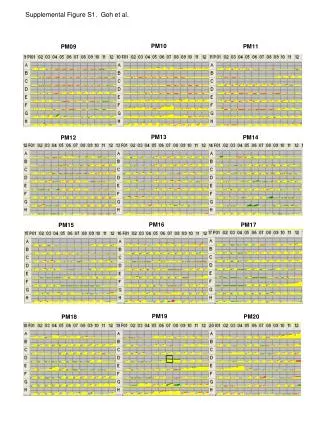
Supplemental Figure S1. Phenotype microarray (PM) analysis of L. acidophilus NCK56 (red) versus L. acidophilus NCK1909 (green). Yellow indicates an overlap or equivalent growth for both strains. These 12 arrays contained the following; PM09; osmolytes, PM10; pH and PM11-20; chemical sensitivity. Substrates in each well are listed in Supplemental Table S2 (PM09 and PM10) and S3 (PM11 – 20). Results displayed are the average of two independent experiments. The box around PM19, well D7 indicates a significant different in response according to Biolog analysis.