Download
1 / 18
180 likes | 350 Views
Measuring the Economy. Goal 9.01 Identifying the phases of the business cycle and the economic indicators used to measure economic trends and activities. I: Measuring Growth of an economy is done by two factors.

E N D
Measuring the Economy Goal 9.01 Identifying the phases of the business cycle and the economic indicators used to measure economic trends and activities.
I: Measuring Growth of an economy is done by two factors. • A: Real GDP: economy’s production after the distortions of price increases have been removed. • B: The Business Cycle: the alternating upward and downward movement of economic activity of growth that a occurs during a growth trend. There are different policies regardingbusiness cycles:1. Classical economists generally favor laissez-faireor noninterventionist policies.2. Keynesians generally favor activist policies
Economic peaks: periods of prosperity, new businesses open, factories are at full production, most people find employment
Contractions in the economy cause a recession: real GDP levels off and begins to decline. • Trough: the lowest point in the business cycle. • Recession: two quarters of declining output • Depression: a deeper and longer recession; low production, high unemployment, business failures • Cycle will begin again if economic activity can rebound. What happens duringbusiness fluctuations?
Expansions: When GDP goes up and the economy is growing and expanding. Employment is low. Expansions are longer than recessions. • Recessions: take place when GDP goes down for six straight months and most last longer. • Average recessions last one year. • Employment declines, production slows, and people lose their jobs. Since 2007 the US has been in a recession according to the National Bureau of Economic Research. In the fall of 2010 the NBER reported the US showed signs of recovery
Other economists argue the US is still in a recession or at least a slow recovery. They point to high unemployment, slow growth of GDP, and stagnant wages as indicators.
Depressions: If a recession becomes severe it can turn into a depression. Huge numbers of unemployed, acute shortages, and excess capacity in manufacturing plants. Look at the graph on page 641. Answer the two questions under analyzing graphs.How does the economy fare during times of war?
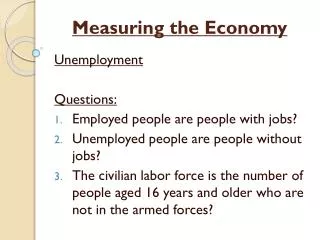
Answer the following questions. • What is Unemployment? Underemployment? • What does civilian labor force mean? • What is the definition of the unemployment rate? • How does a drop in the unemployment rate affect the rise in total income? • When the Federal Government spends more than it takes in we call it a Deficit. • When the Federal Government spends less than it takes in in revenue it is called a Surplus.
Phases of the Business Cycle: Review • The top of the business cycle is called the • peak. • A boom is a very high peak, representing a big • jump in output. The downturn is the phenomenon of • economic activity starting to fall from a peak. • A recession is a decline in output that persists for • more than two consecutive quarters in a year. • A depression is a deep recession.
What connection is there between periods of recession and periods of unemployment?
II: Economic Indicators that measure the economy. • Gross Domestic Product (GDP) is calculated by adding up the value of this country’s annual output of all final goods and services. • Ex: the house, not the lumber, nails, etc. • Ex: everything produced in that country; a Japanese car produced in TN. • Gross National Product (GNP) is a measure of the market value of all goods and services by Americans in one year. • Ex. An American Oil Co. in Scotland • Consumer Price Index (CPI) measures average change in prices for items like housing, food, etc.
How do you calculate the CPI • Used to calculate inflation • CPI for 1979 was 72.6 and the CPI for 1980 was 82.4 • To calculate the inflation rate for 1980 • 82.4-72.6 =9.8 9 (then) 9.8 /72.6 =13.5% • Therefore prices went up 13.5% in 1980
Per Capita GDP is the value of what a person produces in a year. • It is calculated by dividing the GDP by the number of people who live in a nation. • Standard of Living measures prosperity and wealth. Education, income, debt levels, and housing quality contribute to this economic indicator.
III: Government Debt and Global Competition • National Debt: the total amount a country has borrowed plus interest on that debt. • The US debt has reached the trillion dollar mark. • Downsizing: when businesses cut their workforce to cut costs and increase profits. • Outsourcing: when another country, often overseas, manages their operations with foreign workers. Such as customer service or information technology.
IV: Cost-Push Inflation: is defined as persistent rising general price levels brought about by rising input costs. In general, there are three factors that could contribute to cost-push inflation; rising wages, increases in corporate taxes, and imported inflation (when imported raw or partly finished goods become more expensive, often as a result of currency depreciation). For inflation to be cost-push in nature, increases in input prices must affect a large proportion of the country’s producers, so as to be able to push up the general price.
Recent US Federal Debt Numbers • Gross Federal DebtHeld by Public FY 2012 $16.7 trillion $10.8 trillion FY 2011 $15.5 trillion $9.9 trillion FY 2010 $13.5 trillion $8.2 trillion FY 2009 $11.9 trillion $6.8 trillion FY 2008 $10.0 trillion $5.3 trillion Gross Federal • Debt is the total debt owed by the United States federal government. It comprises “debt held by the public” and “debt held by federal government accounts,” such as IOUs owed to the Social Security trust fund. “Debt held by the public” includes debt actually held by the public and foreign governments, and also debt held by the Federal Reserve System, i.e., monetized as part of the monetary base.