Download

1 / 39
390 likes | 555 Views
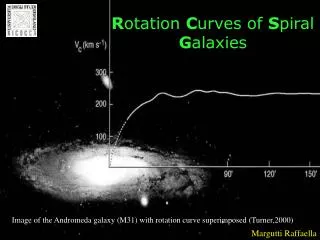
R otation C urves of S piral G alaxies. Image of the Andromeda galaxy (M31) with rotation curve superimposed (Turner,2000). Margutti Raffaella. Index. Definition Historical background Measuring rotation velocities 1. Preliminaries: the doppler effect 2. Emission lines

E N D
Rotation Curves of Spiral Galaxies Image of the Andromeda galaxy (M31) with rotation curve superimposed (Turner,2000) Margutti Raffaella
Index • Definition • Historical background • Measuring rotation velocities 1. Preliminaries: the doppler effect 2. Emission lines 3.Analysis of the observational data 4.Instrumental resolution 5.Dependence on observational methods • Observational properties of rotation curves 1.Universal properties of rotation curves 2.Morphology & RC 3.Luminosity & RC 4.Environment & RC 5.Evolution & RC • Astrophysical importance of rotation curves • References
Definition: A rotation curve (RC) of a galaxy is defined as the trace of velocities on a position-velocity (PV) diagram along the major axis, corrected for the angle between the line of sight and the galaxy disk. (See figure)
Historical background • 1914 Slipher discovered the rotation of M31 and Sombrero galaxy Wolf detected “inclined” lines in M81 nuclear spectrum • 1939 Babcock (and later Mayall in 1951) extended M31 RC to almost 2° from the nucleus. His mass model for M31 showed the mass-to-light (M/L) ratio to increase from inner regions to outer ones. • 1954 Schwarzschild reanalyzed the velocities of M31 and fit with a model of constant M/L • 1959de Vaucouleurs affirmed that “ the rotation velocity decrease with increasing distance from the center and tends asymptotically toward Kepler’s third law”. (It’s important here to remark that high signal-to-noise velocities were NOT available at that time.) De Vaucouleurs and Schwarzschild’s authority make it possible for astronomers to ignore the strange RC identified by Babcock, Oort and Mayall. • 1960The modern era begins with Page and Burbidge & Burbidge. Their observations were based on Hα and [NII] emission lines. In the same period we have also the first radio observations of neutral hydrogen which showed a slowly falling RC for M31 and a flat one for M33. • 2005 A rich variety of techniques are nowadays available ( Hα ,HI, [NII], [SiII],CO, masers emission lines ...), together with higher signal-to-noise velocities and high spatial resolution.
Measuringrotation velocities 1.Preliminaries: the doppler effect Hypothesis: • Axially symmetric distribution of matter cylindrical • Circular orbits of matter coordinates are • Galactic disk with circular shape. suitable The doppler effect can be used to derive the radial velocity (Vr) of something: c light velocity Δλ λr-λe : Doppler shift EMISSION line λ ABSORPTION line Problem: too weak also in nearby galaxies
Edge-on spiral galaxies: Θ(R) Rotation velocity of a generic point P on the disk plane u Velocity of a generic point P of the disk due to its rotational motion on the galactic disk ,as seen by the observer V Velocity of the whole galaxy as seen by the observer , in the direction of the observer Θ(R) R R* α Observer P P* We have:
The complete doppler shift of a single line emitted by matter which is going toward the observer is then: For lines emitted by matter which is going away from the observer: If the cloud of the emitting material is exactly at the tangential point (in other words: P is exactly in P*): • From the measurement of the two quantities above we are now able to find V and θ(R*) !!
Notes: • The importance of finding an emitting cloud at the tangential point lies in the fact that we have NO information available from the observations about the αangle (see previous slide). • The spectrum of the radiation detected is not (obviously) made up of a single narrow line. We have instead a “continuum” with a lot of peaks superimposed. Every peak is associated with an emitting cloud. This fact, consequence of the thermal chaotic motion of atoms in the clouds and of the presence of more than one cloud along the line of sight, complicates the situation. On the other hand, it’s possible to use this complication to get information about the tangential point: From equation above: the peak associated with the maximum of Δλ’is produced by radiation emitted by a cloud in P*(tangential point). (R* is fixed, θ is assumed to be a NON increasing function .This is really the case!)
Inclined galaxies: For galaxies which are NOT edge-on we have to correct for the angle between the line of sight and the galaxy disk. Because of inclination, the circular disk of radius RD will look like an ellipsis of axis : a=RD b=RD cos(i) In the previous discussion it’s enough to substitute u (slide 5) with u sin(i)
2.Emission lines • Hαand optical measurements: -Emission lines traditionally employed: Hα,[NII],[SII]; - Strong emission lines of Hα and [NII] can be moreeasilydetected and measuredthan weak broad H and K absorption lines. -[Si VI]: new technique employed for the first time in the study of NGC1068 (Tecza et al.2000); -For a limited number of nearby galaxies, RC can be produced from velocity of individual HII regions. • HI line -Powerful tool to obtain kinematics of spiral galaxy because of its radial extent: 3 or 4 times greater than that of the visible disk. -Problem : spatial resolution Thanks to instrumental improvements in the last 20 years problems of low spatial resolution are now important only near the nucleus .
CO line -Employed rotational transitions lines of CO: 115.57 Ghz millimeter wave range 230.50 Ghz millimeter wave range -Powerful tool to study the inner disk and central regions of spiral galaxies, for extinction is negligible at CO wavelength. -CO lines are emitted from molecular clouds (the central parts of disks are usually dominated by molecular gas) . These clouds are often associated with star formation regions emitting HαCO is a good alternative to Hαand HI in the inner regions, where HI is often weak or absent. -Major interests in current interferometer observations of CO line emission in nuclear regions are: detailed orientation of the nuclear molecular disk (NMD) and circumnuclear torus; detection of non-circular motion in NMD. • Masers lines Radial velocity observations of masers lines ( SiO,H2O,OH), allows us to measure the kinematics of stellar components and gas clouds in the disk and bulge of our Galaxy
Position-velocity diagram along the major axis of the edge-on galaxy NGC3079 in the CO 115.27 Ghz emission line. Lower panel: composite rotation curve produced by combining the CO results and HI data. (Sofue & Rubin,2001)
Logarithmic RC of the Milky Way (thick line),NGC4258 (thin line) and M31 (dashed line). Innermost rotation velocities are Keplerian velocities calculated for massive black holes. Observational method used are indicated with horizontal lines. It’s important to note that rotational curves are obtained combining CO data for the central regions, optical for disks and HI for outer disk and halo. (Sofue & Rubin 2001).
3.Analysis of the observational data The analysis of the observational data has continued to evolve during the past years as the quality of the data has improved. Emission lines at a point of the spectrum are an INTEGRAL along the line of sight through the galaxy. Only recently the quality of the data has permitted the deconvolution of various components. A few procedures nowadays employed are described below. 3.1 Intensity-Weighted-Velocity Method Intensity-weighted velocities are defined by: Where I(v) is the intensity profile at a given radius as a function of the radial velocity. Rotational velocity is then given by: Where Vsys systematic velocity of the galaxy i angle between the normal to the plane of the galaxy and the line of sight.
3.2 Centroid-Velocity (CV) and Peak-Intensity-Velocity (PIV) Method • In outer galactic disk, the line profiles can be assumed to be symmetric around the peak-intensity value the intensity weighted method can be approximeted by a centroid velocity of half-maximum values of a line profile (CV), or alternatively by the velocity at which the intensity attains its maximum (PIV). Unpublished tests (by V. Rubin) show that centroid velocities of weak emission lines are characterized by less scatter. • Problems arise when these methods are used also for inner regions, where the line profiles are NOT simple but superimpositions of outer and inner disk components. Tests indicate that CV and PIV methods often underestimate the true rotation velocity (See Sofue & Rubin,2000). The same situation occurs for edge-on galaxies (here the line profiles is nothing but the superimposition of profiles arising from ALL radial distances sampled along the line of sight). In these situations we need a different method
Imax maximum intensity, Ilc Intensity corresponding to the lowest contour level (usually ≈ 3 rms noise) η usually taken to be0.2-0.5. For η= 0.2 this equation defines a 20% level of the intensity profile at a given position: It ≈ 0.2 Imax 3.3 Envelope-Tracing (ET) Method This method makes use of the so-called terminal velocity defined by the velocity at which the intensity becomes equal to: The rotation velocity is defined by : Where σISM and σobsare the velocitydispersion of the interstellar gas and the velocity resolution if the observations respectively. Usually σISM≈ 7-10 Km s-1, while σobsdepends on instruments.
The importance of the ET method lies in the fact that both finite beam width and disk thickness along the line of the sight cause confusion of gas with smaller velocities than the terminal one, which often results in a lower rotation velocity in the former two methods. • Problems : ET method is ill-defined when applied to the innermost part of a PV diagram. This is a consequence of the fact that the two sides of the nucleus have a discontinuity principally due to the instrumental resolution (usually large with respect to the velocity gradients. We will deal with this topics later). • This discontinuity is avoided by stopping the ET method at a radius corresponding to the telescope resolution. In the nuclear zone the RC is approximeted by a straight line crossing the nucleus at zero velocity (this would imply a “solid body” rotation, here probably nothing but a poor approximation to the true motions near the centre!)
3.4 Iteration Method We are going to give here only a simple description of this method. (See Takamiya & Sofue for more information ). An initial rotation curve RC0 is adopted from a PV diagram (PV0) obtained using one of the methods described above. Using this RC0 and an observed radial distribution of intensity of the line used in the analysis, a PV diagram, PV1, is constructed. The difference between PV1 (calculated diagram) and PV0 is used to correct the initial RC (RC0) to obtain a corrected one (RC1). Then from RC1 and the distribution of intensity a new PV (PV2) is derived. PV2 is used to obtain the next iteration curve, RC2, and so on. This iteration is repeated until the difference between PVi and PV0 becomes minimum and stable. RCi is adopted as the most reliable RC.
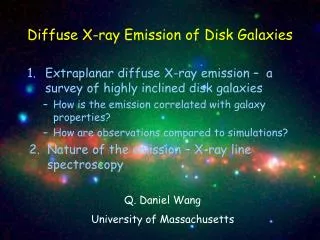
4.Instrumental Resolution In the reality observers have to deal with problems arising from finite resolution of instruments employed, scattering, extinction of the signal due to dusty nuclear disks (this problem is lessened at the CO lines wavelength). In this figure you can find a simulation of the effect of beam-smearing (which arises from the finite instrumental resolution) on a PV diagram. Top An assumed “true” rotation curve (thick one) comprising a central core, bulge, disk and halo (dashed curves, from inner to outer respectively). Thin lines: assumed density of molecular (inner) and HI gas (outer) distributions. Middle An “observed” PV diagram in CO. Bottom An “observed” PV diagram in HI. It’s now clear that high resolution is crucial in order to detect central high velocities and steep rise
5.Dependence on observational methods Results are a function of the techniques of observations and reductions: • Observations from emission lines in the optical, millimeter, and radio regions may NOT sample identical regions along the SAME line of sight. • Instruments sample at different sensitivities with different wavelength and spatial resolution. A simple RC is an approximation as a function of radius to the full velocity field of a disk galaxy. It’s obtained by neglecting small-scale velocity variations and by averaging and smoothing rotation velocities from both sides of the galactic center .
Observational properties of RC Rotational curves of spiral galaxies have their individualities but they also share many characteristics. This fact has led to a variety of attempts to categorize their shapes and to establish their statistical properties. (See for example Roberts,1975; Burbidge & Burbidge,1975; Kyazumov, 1984; Marquez et al.2003; Evstigneeva, 2001). We will look at rotation curves as function of: • Morphology ; • Luminosity; • Environment; • Evolution; Before giving a detailed description, is really useful to have a look at some observed rotation curves.
Photograph, spectra and RC for five Sc galaxies, arranged in order of increasing luminosity from top to bottom. The vertical line in each spectrum is continuum emission from the nucleus. The distances reported are based on a Hubble constant h=0.5. (Binney, Tremaine)
Rotation curves of spiral galaxies from optical measurements
Rotation curves of spiral galaxies from 21-cm radio measurements
Rotation Curves of spiral galaxies obtained by combining CO data for the central regions, optical for disks, HI for outer disk and halo. (Sofue et al.,1999)
1.Universal properties of RC’s • Inner regions are characterized by a steep rise of the rotation velocity θ(R). With some approximations we can say that here θ(R)≈R(linear). • θ(R) reaches its maximum of 200-300 Km/s at distances of the order of 0.1 Kpc. • Depending on the galaxy, sometimes exists an intermediate region (corresponding to the bulge and internal part of the galactic disk) characterized by irregularities and fluctuations. Usually θ(R) has a minimum at R≈ 1 Kpc and then rises until it reaches a second maximum at R ≈ 4-10 Kpc . • For R grater than the optical one rotation curves are extremely regular (no more fluctuations are detected). The most important feature is that here RC’s are FLAT θ(R)≈ constant.( The image of Andromeda in the first slide is a good example of what we are speaking about). This fact has a lot of implication in the dark matter problem (now a reality thanks to RC observations). See Roncadelli,2004. These common properties are really universal for R >0.5 optical radius. Inner rotation curves have greater individuality (Sofue et al.1999).
2.Morphology & RC 1.1 Sa, Sb and Sc Galaxies Sa • The maximum rotation velocities are higher than those of Sb and Sc galaxies with equivalent optical luminosities (See slide 22). Sb • High central core , including the massive black hole, which causes a nonzero velocity very close to the center. • Steep central rise at 100-200 pc often associated with a velocity peak at radii ≈ 100-300 pc (Sofue et al.,1999). • The maximum is usually followed by a decline to a minimum at 1-2 Kpc • Gradual rise to a maximum at 6 Kpc due to the main disk • Nearly flat outer-rotation curve. We can find these features in the Milky Way (typical Sb galaxy) rotation curve. (Showed in previous slides).
Sc • Massive Sc galaxies show steep nuclear rises similar to those of Sb galaxies. Less massive Sc galaxies have more gentle rises. • They show flat rotation to their outer edges. • Low-surface-brightness Sc galaxies have gentle central rises with monotonically increasing rotation velocities toward the edge, similar to dwarf galaxies. (Bosma et al.,1988). Median values of Vmax are reported (Roberts 1978,Rubin et al.1985,Sandage 2000)
Barred Galaxies • Large scale rotation properties of SBb and SBc galxies are generally similar of those of non-barred galaxies (Sb and Sc). • The study of their kinematics is more complicated (in theory as well as in practice) because their gas tracers are less uniformly distributed and their iso-velocity contours are skewed in the direction toward the bar. • Co-line mapping and spectroscopy reveal the presence of NON-circular motions in the nuclear molecular bar. From a theoretical point of view it has already been shown that an oval potential such is due to a bar produces shocks of interstellar material, and the shocked gas streams along the bar in non-circular orbits. (Sorensen et al.1976,Noguchi 1988,Wada & Habe 1992,1995, Shlosman et al.1990). • High velocities variations arising from the barred potential.( Simulations of PV diagrams show fluctuations of tens kilometers per second superposed on the usual RC.(Athanassoula &Bureau 1999, Bureau & Athanassoula 1999).
Dwarf Galaxies Only within the past decade instrumental improvements have made it possible to study the kinematics of dwarf galaxies, galaxies of low mass. Observational problem: many of them are small in angular extent, so observations are subject of important beam smearing. • Most of the rotation curve shape are similar to those of spiral galaxies. • Dwarfs tend to show increasing outer RC, whereas most massive galaxies have slightly declining rotation in the outmost part. • Dwarfs usually show gentle central rises. Sa and Sb types show steeper rises and higher central velocities. • Dwarf with higher central light concentrations have more steeply rising rotation curves. Irregular galaxies • Rotation curve of irregular galaxies usually show peculiar features. • Some irregular galaxies exhibit normal rotation curves, such as observed for a ring galaxy NGC 660, amorphous galaxy NGC 4631 and NGC 4945. (Sofue et al.,1999). • Polar ring galaxies provide a unique opportunity to probe the rotation and mass distribution perpendicular to galaxy disc.
HI velocity field of the LMC (dwarf galaxy) superposed on a Hαimage and a position-velocity diagram along the major axis. The ellipse indicates the position of the optical bar. Thick line in PV diagram traces the rotation curves (corrected for the inclination angle of 33°). (Sofue, Rubin,2001)
3.Luminosity & RC • Very luminous galaxies tend to have higher peak velocity. The broad maximum in the disk is followed by a slightly declining RC. • Intermediate galaxies have nearly flat rotation across the disk. • Less luminous ones tend to show increasing outer RC. At lowest luminosities there is more variation in the shape of the RC.
4.Environment & RC 4.1 Cluster galaxies and field galaxies First of all it’s important to distinguish between galaxies in clusters and field-galaxies. A variety of mechanism can alter the internal kinematics of spiral in clusters: gas stripping, star stripping, galaxy-galaxy encounters, interaction with the general tidal field. • There’s a correlation between outer rotation-velocity gradients and distance from the cluster centre: inner-cluster galaxies show shallower rotation curves than do outer- cluster galaxies. (Rubin et al.,1988). • A study of 81 galaxies in the Virgo cluster (Rubin et al.,1999),shows that about 50% of them have rotation curves identified as disturbed: asymmetrical rotation on the two sides of the major axis, falling outer rotation curves, inner velocity peculiarities. For the field galaxies, 74% exhibited rotation curves are normal.
4.2 Rotation curves as a function of the overall spatial density of luminosity • The results of the study made by Evstigneeva & Reshetnikov (See Evstigneeva & Reshetnikov,2001), show that the shape of the rotation curve doesn’t depend on the overall spatial density of luminosity. • The only difference lies in the fact that rotation curves of galaxies in regions with high spatial density of luminosity can be traced out to smaller relative distances from the nucleus. This may related to the destruction of the outer regions of their gaseous disks in gravitational interactions with surrounding galaxies.
5.Evolution & RC We directly observe galaxy evolution by studying galaxies closer to their era of formation. Modern techniques have made it possible to obtain rotation curves for distant spirals with z ≈ 1 (thanks to Keck and HST). • The rotation properties are similar to those of nearby galaxies, with peak velocities between 100 and 200 Km/s. Regularly rotating spiral galaxies existed at z ≈ 1. Spiral galaxy evolution, over the last half of the age of the universe, has not dramatically altered the rotation kinematics of spiral galaxies.
Astrophysical importance of rotation curves We end this work with some words about the astrophysical importance of rotation curves. Rotation curves are tools for several purposes: • For studying the kinematics of galaxies; • For inferring the evolutionary histories and the role that interactions have played; • For observing evolution by comparing rotation curves in distant galaxies with galaxies nearby. • For relating departures from the expected rotation curve form, to the amount and distribution of dark matter;
Where r distance from the galaxy centre; M(r) enclosed mass; According to Newtonian dynamics, it’s simple to show that From measurements of Vrot we have some information about the distribution of mass in the galaxy. In particular: • Inner regions : The RC rises linearly with galactocentric distance • • Outer regions: The RC is nearly flat The enclosed mass then rises linearly with galactocentric distance. It’s enough to have a look at the first image of this work (RC of the Andromeda galaxy), to understand that we NEED MATTER, and to be more precise, DARK matter in order to explain the features of the RC. A simple example: the rotation curve is FLAT where we don’t see matter, or better: where we don’t see SHINING matter.
References • Athanassoula, Bureau:Ap.J.522:699,1999. • Bureau, Athanassoula: Ap.J.,522:686. • Binney, Tremaine: Galactic dynamics, Princeton University Press,1987 • Bosma, van der Hulst, Athanassoula: Astron. Astrophys.,1988. • Burbidge & Burbidge: Stars and stellar systems IX: galaxies and the universe,1975. • Evstigneeva, Reshetnikov: Rotation curves of galaxies in various space environments, Astrophycics, Vol:44,2001. • Giovanelli, Haynes: The inner scale length of spiral galaxy rotation curve, Ap.J.,L107-L111,2002. • Kyazumov: Astron.Zh. 61:846; • Marquez et al.: Isolated and mildly interacting spiral galaxies: rotation curves and metallicities, Astrophysics and space science, Vol:248,2003. • Noguchi: Astron. Astrophys.,203:259,1988. • Roberts: Galaxies in the universe, Univ. Chicago Press,1975 • Roberts: Astron. J.,83:1026,1978. • Roncadelli:Aspetti astrofisici della materia oscura,Bibiliopolis,2004
References • Rubin, Thonnard,Ford:Ap.J.Lett. 225:L107,1978. • Rubin,Whitmore, Ford; Ap.J.,333:522,1988. • Rubin,Waterman,Kenney: Ap.J.,333:522,1999. • Sandage:PASP 112:504,2000. • Shlosman,Begelman,Frank:Nature,345:679,1990. • Sorensen et al.,Astrophys.Space Sci.43:491,1976. • Sofue, Rubin: Rotation Curves of Spiral Galaxies, Annual Review of Astronomy and Astrophysics,2001. • Sofue,Tomita,Honma,Tutui: Publ. Astron. Soc.Jpn.1999, 51:737. • Sofue, Tutui, Honma,Tomita,Takamiya: ApJ ,1999, 523:136. • Takamiya,Sofue: Exact Rotation Curves, Astrophysical Journal, 576, L15. • Tecza et al., In IAU Symp. No. 205,2000. • Turner: the dark side of the universe: from Zwicky to accelerated expansion, Physics Reports, 2000, 333-334, 619-635. • Wada & Habe: Mon. Not.R.Astron.Soc.,277:433,1995. • Wada & Habe: Mon. Not.R.Astron.Soc.,258:82,1992.