Download
1 / 37
380 likes | 538 Views
Preventable/Avoidable Emergency Department Use in Massachusetts Fiscal Years 2004 to 2008 July 2010. Deval L. Patrick, Governor Commonwealth of Massachusetts Timothy P. Murray Lieutenant Governor. JudyAnn Bigby, M.D., Secretary Executive Office of Health and Human Services

E N D
Preventable/Avoidable Emergency Department Use in MassachusettsFiscal Years 2004 to 2008 July 2010 Deval L. Patrick, GovernorCommonwealth of Massachusetts Timothy P. MurrayLieutenant Governor JudyAnn Bigby, M.D., SecretaryExecutive Office of Health and Human Services David Morales, CommissionerDivision of Health Care Finance and Policy
Table of Contents Study Goals and Policy Implications 3 Major Findings on Preventable/Avoidable ED Visits in Massachusetts 4 Data and Methods 5 Volume and Costs Associated with Preventable/Avoidable ED Visits 6 Leading Conditions for Preventable/Avoidable ED Visits 12 Distribution of ED Visits by Time of Day and Day of the Week 13 Trends in ED Visit Categories from FY04 to FY08 15 Preventable/Avoidable ED Visits by Payer Category 22 Preventable/Avoidable ED use for Designated Health Professional Shortage Areas and Community Health Network Areas 26 Preventable/Avoidable ED Use by Patient Demographic 33
Study Goals and Policy Implications Study Goals This analysis is designed to answer three questions: • To what extent are Massachusetts hospital emergency departments (EDs) being used for treatment of conditions that are considered non-emergent or amenable to primary care treatment? What are the costs associated with such use? • Do preventable/avoidable ED visit rates differ by certain patient demographics including race/ethnicity, age, payer type and regional differences? If so, what might be learned from those differences? • How has expanded health coverage impacted the use of hospital EDs over time (pre and post health reform) for emergent and preventable/avoidable ED visit categories? Policy Implications • The use of hospital EDs for treatment of conditions that are non-emergent or amenable to primary care can be an indicator of access barriers to appropriate primary care. As such, the rate of preventable or avoidable ED visits provides insight into the quality and accessibility of the health care system in the surrounding community rather than the performance of a specific hospital. • Differences in preventable/avoidable ED use by geographic area and/or socio-economic factors can inform us about barriers to primary care that may exist for certain populations of the state and provide insight into the relative depth and success of patient education efforts for different populations in how to use the health care delivery system. • The costs of treating a patient in an ED for the same condition is significantly higher than in a physician’s office. Therefore, unnecessary or avoidable ED treatment leads to excess costs. These costs are due to higher overhead for the same procedures as well as additional diagnostic testing that may be ordered due to lack of medical records and patient familiarity that would be present for one’s primary care physician. • ED visits for non-emergent and primary care treatable conditions may contribute to ED overcrowding and take away resources needed for traumatic and urgent conditions.
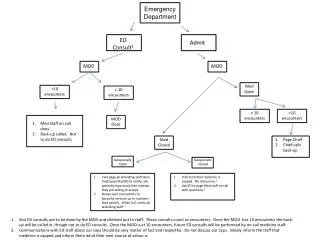
Major Findings on Preventable/Avoidable ED Visits in Massachusetts How does ED usage differ by payer category? At 55% each, CommCare and Medicaid patients had the highest proportion of their ED visits considered preventable/avoidable when compared to 48% for Medicare and private payers and 52% for the uninsured. Across all payers, 5.4% of ED visits were for mental health or substance-abuse-related issues. However this also differed by payer category, ranging from 3.6% (private payers) to 8.1% (Medicaid). Twenty-six percent of ED visits by Medicaid patients were attributable to frequent ED users (those with 5 or more visits in the fiscal year). How does preventable/avoidable ED use differ regionally and for designated health professional shortage areas (HPSA)? The proportion of ED visits that were considered preventable/avoidable varies within Community Health Network Areas (CHNA) defined by the Department of Public Health. The CHNAs with the highest per capita rates of preventable/avoidable ED use had rates that were 3 to 5 times higher than the CHNAs with the lowest rates. Given that the goal of each CHNA is to promote community health planning through partnerships that enhance preventive, primary care models, the rate of preventable/avoidable ED visits may provide insight into their relative success. Areas designated as medically underserved populations (MUPs) based on low income were found to be consistently associated with higher rates of preventable/avoidable ED visits, while geographic health professional shortage areas based on population to primary care provider (PCP) ratios were not consistently associated with higher rates of preventable/avoidable ED visits. How does preventable/avoidable ED use differ by patient demographic (race/ethnicity, age and gender)? Hispanics and blacks experienced the highest preventable/avoidable ED visit rates per capita with rates that were nearly 2.5 times the rate of whites. Note that these rates are not adjusted for socio-economic factors. Although rates of emergent visits were also higher for blacks and Hispanics, preventable/avoidable visits were disproportionately higher. Preventable/avoidable ED visit rates also differed significantly by age group. The highest rates were found for infants and young children under the age of 5 as parents may seek immediate care for infant fevers, etc. The second highest rate was found for the young adult age group. Females had a higher per capita rate of preventable/avoidable ED visits compared to males. What are the volume and costs associated with preventable/avoidable ED visits? Nearly one-half of outpatient ED visits* by Massachusetts residents were considered potentially preventable/avoidable in fiscal year 2008 (FY08), amounting to more than $514 million.** Eighty-eight percent of preventable/avoidable ED visits were categorized as non-emergent (e.g., sore throat or back pain) or primary care treatable, (e.g., infant fever). Another 12% of preventable/avoidable ED visits were for emergent conditions that might have been prevented with better primary care (e.g., asthma flare-up). One-third of the preventable/avoidable visits, including those that could have been treated in a physician’s office, occurred during regular business hours. This suggests that lack of access to physicians due to office closure is not a significant driver of primary care treatable ED visits. Frequent users (ED visitors with 5 or more ED visits in the fiscal year) make up 4% of ED users and account for 20% of total ED visits. Fourteen percent of preventable/avoidable ED visits and 35% of alcohol-related ED visits were made by frequent users. How has the volume of ED visits changed over time? Outpatient ED visits increased between 1 to 3% annually between FY04 and FY08, a 9% increase from 2004 to 2008. Emergent ED visits were relatively stable over the period, whereas preventable/ avoidable visits increased by 13%. There was also a 20% increase in ED visits for mental health and alcohol/substance-abuse-related conditions (which made up 5% of total outpatient ED visits). Of the mental health/alcohol and substance-abuse-related ED visits, alcohol-related visits increased the most. It should be noted that mental health/alcohol and substance abuse related ED visits are not included in the preventable/avoidable category. The increase in ED visits may not be surprising given expanded health care insurance coverage. Several studies indicate that the uninsured generally do not account for a larger share of avoidable ED visits--reliance on the ED may be due instead to outpatient capacity constraints, which may be exacerbated by the newly insured seeking to establish primary care. Frequent users made up an increasing share of users from 2004 to 2008 and were responsible for an increasing share of ED visits, increasing from 17% of visits in 2004 to nearly 20% of visits by 2008. Notes: *This analysis is based on outpatient ED visits (those that do not result in an inpatient stay). If we include visits that result in an inpatient admission and assume all of those to be emergent, then preventable or avoidable ED visits make up 40% of ED visits rather than 49%. **It is presumed that some portion of these expenditures would still be incurred for the alternative primary care visit.
Data and Methods The Data • The data used in much of these analyses are from the DHCFP Outpatient ED Database, which includes visit-level information for those ED patients who are discharged as outpatients and not admitted to the reporting hospital. The data include ED visits reported to DHCFP by Massachusetts hospitals. Where irregularities were identified and confirmed for specific hospitals, statistical adjustments were made to provide accurate trend and level analysis. Footnotes throughout describe any necessary adjustments. This analysis is limited to visits for fiscal years 2004 through 2008. A fiscal year runs from October 1 through September 30 of each year. Methodology • How visit types are defined: The categories of visit type (Emergent vs. Preventable/Avoidable, and Other) are based on the New York University ED data algorithm developed by John Billings in 2001. The algorithm evaluates the urgency, need for resources typically available in EDs but not in physician offices, and whether the patient’s condition was preventable with good primary care. Visits were grouped into nine categories using discharge diagnosis. • Modifications to Billings Algorithm: Since its creation, there has been no update to the Billings algorithm to account for newly introduced ICD-9 codes. As a result, we found that the unclassified visit category was the fastest growing category over time, thereby distorting the trend for all other categories. After consultation with John Billings, we confirmed that the distortion problems were related to the new ICD-9 codes. With assistance from Peter B. Smulowitz MD, MPH, attending physician, Department of Emergency Medicine at Beth Israel Deaconess Medical Center, the Division reclassified the most significant group of ICD-9 codes that fell into the unclassified category using the same basic logic used by Billings. The proposed method for the adjustment as well as the results were also reviewed by Mr. Billings. Before the adjustment, the percentage of the unclassified category visits to total ED visits increased from 2004 to 2008 from just over 6% to nearly 10%. After the update, the percentage of unclassified category remained stable at 6% for each year. • Specific definitions for each category of the algorithm are described in more detail later in this report. For more detail on the Billings algorithm see http://www.ahrq.gov/data/safetynet/toolsoft.htm Characteristics of ED Visits to Massachusetts Hospitals • About 82% of the total ED volume each year involves patients who are treated in the ED and discharged (ED Outpatient). Patients treated in the ED and admitted to inpatient or observation stay made up the remaining 18%. • Visits from Non-Massachusetts residents comprise approximately 4% of total ED visits per year. • Every year, about 51% of the inpatient admissions come through the ED. • This analysis of preventable/avoidable ED use is based on visits by MA residents only and those that did not result in an inpatient admission. If we include visits that result in an inpatient admission and assume all of those to be emergent, then preventable or avoidable ED visits make up 40% of ED visits rather than 49%.
What Are the Volume and Costs Associated with Preventable/Avoidable ED Visits? Characteristics of MA Preventable/Avoidable ED Visits Findings: • Nearly one-half of outpatient ED visits by Massachusetts residents were considered potentially preventable/avoidable in fiscal year 2008. These visits accounted for $514 Million or 46% of total ED estimated costs.* • The majority (88%) of preventable/avoidable ED visits were categorized as non-emergent (e.g., sore throat or back pain) or primary care treatable (e.g., infant fever). Another 12% of preventable/avoidable ED visits were for emergent conditions that might have been prevented with better primary care (e.g., an asthma flare-up). • The top 5 conditions characterized as preventable/avoidable ED visits were acute bronchitis, abdominal pain, cellulitis and abscess, acute pharyngitis (sore throat) and back pain. • The average cost per visit was highest ($722) for emergent illnesses or conditions such as heart attacks or appendicitis. The least expensive ED visit ($380) was that associated with a non-emergent condition such as a sore throat or back pain. • One-third of both the emergent (traumatic injury and illness) and the preventable/avoidable visits (including those conditions that could have been treated in a physician’s office) occur during regular business hours. This suggests that lack of access to physicians due to the fact their office is closed is not a primary driver of primary care treatable ED visits. • Frequent users (ED visitors with 5 or more ED visits in the 12-month period) made up 4% of ED users, accounted for 20% of total ED visits, and had, on average, 8 visits in 12 months. Frequent users accounted for 14% of preventable/avoidable visits and more than one-third of all alcohol-related ED visits. *Note that some portion of these estimated costs would likely still be incurred for the primary care alternative visit.
Nearly Half of Outpatient ED Visits Were Potentially Preventable or Avoidable, FY08 Total Outpatient ED Visits (MA residents): 2,396,733* Of the nearly 2.4 million outpatient ED visits for MA residents, 49% were considered preventable or avoidable. Emergent visits made up 39% of outpatient ED visits. More than 5% of outpatient ED visits were for mental-health-related issues. Preventable or avoidable ED visits are those considered to be non-emergent or ambulatory care sensitive. Note: The breakdown of visit types is based on outpatient ED visits (82% of ED visits). If we include visits that result in an inpatient admission and assume all of those to be emergent, then preventable or avoidable ED visits make up 40% of ED visits rather than 49%. *ED visits included here are restricted to MA residents only and those that did not result in a hospital admission.
Total Outpatient ED costs (MA residents): $1,129,899,735* 100% Unclassified $64,079,718; 6% of ED Estimated Costs Mental Health** 90% 80% Emergent 70% 60% 50% 40% Preventable/ 30% $514,019,391 46% of ED Estimated Costs Avoidable 20% 10% 0% Preventable/Avoidable ED Visits Cost $514M or 46% of Outpatient ED Visit Costs, FY08 Of the $1.1 billion in outpatient ED costs, 46%, or $514 million was spent on ED visits considered potentially preventable or avoidable. Visits for mental-health-related issues cost $64 million. Preventable or avoidable ED visits are those considered to be non-emergent or ambulatory care sensitive. Note: The breakdown of visit types is based on outpatient ED visits (82% of ED visits). If we include visits that result in an inpatient admission and assume all of those to be emergent, then preventable or avoidable ED visits make up 38% of ED visit costs rather than 42%. $476,829,747 42% of ED Estimated Costs *ED costs included here are restricted to MA resident only and those that did not result in a hospital admission. **Mental Health includes visits for mental health, alcohol and/or substance-abuse-related causes. Cost estimates are based on fiscal year charges and assume a statewide cost to charge ratio of 35.2%. Note that some portion of the estimated costs for preventable/avoidable ED visits would likely still be incurred for the primary care alternative visit.
Categorizing ED Visits: Definitions for Emergent vs. Preventable/Avoidable ED Visits • Emergent Visit: Any condition that requires care within 12 hours and the condition does not fall into one of the following three preventable/avoidable categories. These include trauma and injury as well as emergent conditions that could not have been treated in a physician’s office or avoided with better ongoing primary care. • Preventable/Avoidable Visit: • Non-Emergent: Care was not required within 12 hours (e.g., sore throat) • Emergent but Primary Care Treatable (PCT): The condition required treatment within 12 hours, however the condition could have been treated in a primary care setting (e.g., infant fever) • Emergent but Preventable Condition: The condition required treatment within 12 hours, however, the urgency of the condition could have been avoided with better primary care (e.g., asthma flare-up). Note: Mental health and alcohol and substance abuse related ED visits are a separate category. Massachusetts Division of Health Care Finance and Policy - 9
Decomposition of Outpatient ED Visits and Estimated Costs by Category, FY08 Outpatient ED Visits** 2,396,733 (100%) Of potentially preventable or avoidable ED visits, non-emergent visits such as those for sore throats, back pain and rashes make up the largest share (23%) followed by emergent but primary care treatable visits such as infant fevers and abdominal pain (21%). Not surprisingly, the largest share of costs are associated with injuries and trauma. Preventable or Avoidable (49.2% of visits) (45.5% of costs) Mental Health* (5.4% of visits) (5.7% of costs) Unclassified (6.3% of visits) Emergent – Not Preventable or Avoidable (39.0% of visits) (42.2% of costs) Injury (29.0% of visits) (26.8% of costs) Non-Emergent (22.6% of visits) (18.2% of costs) Emergent Condition (10.1% of visits) (15.4% of costs) Emergent but Primary Care Treatable (20.7% of visits) (21.4% of costs) Emergent but Avoidable Condition (6.0% of visits) (5.9% of costs) *Mental Health includes visits for mental health, alcohol and/or substance-abuse-related causes. **Outpatient ED visits comprise 82% of total ED visits. The rest are admitted to the hospital. If we include visits that result in an inpatient admission and assume all of those to be emergent, then preventable or avoidable ED visits make up 40% of ED visits rather than 49%.
Cost of Non-Emergent ED Visit Was 2.5 Times CHC Visit for Similar Condition Mean cost per visit by condition type The average cost per visit was highest for emergent illnesses or conditions such as heart attacks or appendicitis. The least expensive ED visit was associated with a non-emergent condition such as a sore throat or back pain. The average Medicaid payment for a non-emergent ED visit in 2008 was significantly higher than the typical office visit for a similar condition performed in a primary care setting. For example, Medicaid paid $126 for a CHC office visit in 2008 compared to $316 for a non-emergent ED visit. PCT = Primary care treatable; Cost estimates are based on per visit charges and assume a cost to charge ratio of 35.2%.
Leading Conditions for Preventable/Avoidable ED Visits, FY08 Total Preventable/Avoidable ED Visits: 1,180,138 The top 12 conditions listed made up nearly one-half of total preventable/avoidable ED visits. The majority of the conditions are considered primary care treatable and/or non-urgent. Asthma, responsible for more than 3% of preventable or avoidable visits, is considered urgent but preventable if the illness is managed properly by primary care. There has been little change in this distribution from 2004 through 2008. UTI is urinary tract infection. These conditions are not adjusted for co-morbidities.
One-Third of Both Emergent and Preventable/Avoidable Visits Occur During Regular Physician Office HoursDistribution of ED visits by time of day and day of week, FY08 More than one-third of both emergent and preventable/avoidable ED visits occur during hours when physician offices are open. This distribution of visits by time/day is relatively the same for each category of preventable or avoidable visits, including those that are emergent, but could be treated in the primary care setting (physician’s office). This suggests that lack of access to care due to closed physician offices is not a primary driver of primary care treatable ED visits. This distribution changed little from 2004 through 2008.
Four Percent of Patients Were Frequent ED Users, Accounting for 20% of Outpatient ED Visits in FY08Frequent Users and Visits by Frequent Users by Category of Visit, FY08 Overall, 4% of patients had 5 or more ED visits in a 12-month period, accounting for 20% of the total outpatient ED visits in a given year. 7% of patients having alcohol-related ED visits were considered frequent users. Frequent alcohol-related ED users had an average of 10 visits in the 12 month period and accounted for 35% of all ED visits for alcohol-related conditions in FY08. The trend analysis that follows, shows that alcohol-related ED visits have increased dramatically from 2004 to 2008. Frequent users are defined as those patients with 5 or more visits in the fiscal year. *The base is the total visits made within each category of visit type. **Mental health, alcohol and substance abuse ED visits are not included in the preventable/avoidable ED visit category.
How Has the Volume of Preventable/Avoidable ED Visits in Massachusetts Changed over Time? Trends in ED Visit Categories from FY04 through FY08 Findings: • As might be expected, ED visits that were the result of injury or non-preventable conditions remained relatively stable from 2004 to 2008, however, the rate of preventable/avoidable ED visits increased steadily. • The increase in preventable/avoidable ED visits may not be surprising in the wake of expanded health care insurance coverage since several studies indicate that the uninsured did not account for a larger share of avoidable ED visits. Reliance on the ED may instead be due to primary care capacity constraints, which may be exacerbated by the newly insured seeking to establish primary care relationships. • Of preventable/avoidable ED visits, non-emergent and primary care treatable visits increased fastest, 14% and 13%, respectively from FY04 to FY08. • Mental-health-related visits increased by 20% over the period with the sharpest increase seen for alcohol-related visits. There was a sharp decrease in drug-related visits from 2006 to 2007, followed by an increase from 2007 to 2008. This trend was evident across most drug-related categories and did not appear to be the result of data anomalies or new or defunct diagnostic codes. • Visits attributed to frequent users (5 or more visits in a fiscal year) increased from 16.7% of total outpatient ED visits in FY04 to 19.3% in FY08.
Outpatient ED visits Increased Modestly Each Year FY04 to FY08Percentage change in the number of ED visits, unadjusted and adjusted for population changes The volume of outpatient ED visits increased between 1.3% to 2.4% each year between FY04 and FY08 after adjusting for population changes over the period. Unadjusted changes were similar, ranging from 1.5% to 2.6%. Notes: Due to reported data errors in 2004 and 2005 two hospitals’ data (comprising approximately 4% of outpatient ED visits in each year) are excluded from this and the following trend analyses for all years so as not to distort trends. In addition, because of changes in 2007 that led to improvements in the patient state identification, the trend analyses are based on all ED visits (not restricted to MA residents), so the trends would not be artificially increased by the improvement in state identification. Population data for the adjustments are from the U.S. Census Bureau, “Annual Estimates of the Resident Population for the United States, Regions, States, and Puerto Rico: April 1, 2000 to July 1, 2008” (NST-EST2008-01).
Research Finds ED Use Not Expected to Decline with Expanded Coverage Several national and local studies have found that the volume of ED visits should not be expected to decrease as insurance coverage expands, and in fact indicate that increases may occur for the following reasons: • The uninsured make up only a small percentage of ED visits and do not have a larger proportion of preventable/avoidable ED visits compared to the insured population. • Reliance on the ED may be due to outpatient capacity constraints, which may be exacerbated by difficulties encountered by the newly insured as they seek to establish primary care relationships Among the studies and articles cited:What Accounts for Difference in the Use of Hospital Emergency Departments Across U.S. Communities? Peter J. Cunningham; Health Affairs. 25 no.5 (2006) w324-w336 (published online 18 July 2006) DOI: 10.1377/hlthaff.25.w324 Does lack of a usual source of care or health insurance increase the likelihood of an emergency department visit? Results of a national population-based study Ellen J. Weber, Jonathan A. Showstack, Kelly A. Hunt, David C. Colby, Michael L. Callahan; Annals of Emergency Medicine – January 2005 (Vol. 45, Issue 1, Pages 4-12, DOI 10.1016/j.annemergmed.2004.06.023) Myths and Facts: Would expanding health coverage ease emergency department overcrowding and reduce spending?http://callhealthreform.org/contents/view/39/ Emergency Department Visits in Massachusetts: Who Uses Care and Why? A Massachusetts Health Reform Survey Policy Brief, Sharon K. Long; Karen Stockley: Urban Institute, Blue Cross Blue Shield Foundation, The Commonwealth Fund, The Robert Wood Johnson Foundation, September 2009 Health Insurance Transitions and Emergency Department Utilization Mortensen K, McLaughlin C; AcademyHealth. Meeting (2005: Boston, MA) Abstr AcademyHealth Meet.2005; 22:abstract no. 3015 Massachusetts universal coverage does not reduce ED visits, polls say; Susan Landers, AMA, published online amednews.com; http://www.ama-assn.org/amednews/2009/10/19/prsf1020.htm
Emergent ED Visits Were Relatively Stable 2004 to 2008, while Preventable/Avoidable ED Visits Increased 13%Indexed trend of outpatient ED visits in MA, FY04-FY08 Index: 2004=100 Total outpatient ED visits increased 9 percent from 2004 to 2008. Emergent ED visits were relatively stable over the period, whereas preventable/avoidable visits grew by 13%. Mental health and substance abuse ED visits, which make up 5% of outpatient ED visits, increased by 20% over the period. Notes: Due to reported data errors in 2004 and 2005 two hospitals’ data (comprising approximately 4% of outpatient ED visits in each year) are excluded from this and all trend analyses for all years so as not to distort trends. In addition, because of changes in 2007 that led to improvements in the state identification, the trend analyses are based on all ED visits (not restricted to MA residents), so the trends would not be artificially increased by the improvement in state identification. Mental health includes mental health, alcohol and substance-abuse-related visits.
Of Preventable/Avoidable ED Visits, Non-Emergent and Primary Care Treatable Visits Increased FastestIndexed trend of preventable/avoidable categories of outpatient ED visits in MA, FY04-FY08 Index: 2004=100 Both non-emergent (e.g., sore throats, etc.) and emergent, but primary care treatable (PCT), visits (e.g., infant fevers) increased fastest between 2005 and 2007. Emergent, but preventable, conditions (e.g., asthma) increased between 2005 and 2006, but then remained relatively flat. 100 Notes: Due to reported data errors in 2004 and 2005 two hospitals’ data (comprising approximately 4% of outpatient ED visits in each year) are excluded from this and all trend analyses for all years so as not to distort trends. In addition, because of changes in 2007 that led to improvements in the patient state identification, the trend analyses are based on all ED visits (not restricted to MA residents), so the trends would not be artificially increased by the improvement in state identification. PCT is primary care treatable.
Alcohol-Related ED Visits Increased 35% over the Period; Drug-Related ED Visits Decreased Sharply in 2007Indexed trend of mental health ED visit categories, FY04-FY08 Index: 2004=100 The most significant increase observed in the mental-health-related categories was for alcohol-related ED visits. The decrease in drug-related visits in 2007 was observed for all specific causes of drug-related visits including drug dependence, opiods, and non-dependent abuse. The subsequent increase was also apparent for all categories. 100 Notes: Due to reported data errors in 2004 and 2005 two hospitals’ data (comprising approximately 4% of outpatient ED visits in each year) are excluded from this and all trend analyses for all years so as not to distort trends. In addition, because of changes in 2007 that led to improvements in the state identification, the trend analyses are based on all ED visits (not restricted to MA residents), so the trends would not be artificially increased by the improvement in state identification.
The Percent of ED Visits Attributable to Frequent ED Users Increased by 2.6 Percentage Points from FY04 to FY07 Frequent ED users made 19.3% of outpatient ED visits (5 or more visits in the fiscal year) in FY07 compared to 16.7% in FY04. The rate remained stable from 2007 to 2008. In FY08 4.2% of ED patients were considered frequent users. This was an increase from 3.4% in FY04. The percent of visits made by frequent users remained stable between 2007 and 2008. Notes: Due to reported data errors in 2004 and 2005 two hospitals’ data (comprising approximately 4% of outpatient ED visits in each year) are excluded from this and all trend analyses for all years so as not to distort trends. In addition, because of changes in 2007 that led to improvements in the state identification, the trend analyses are based on all ED visits (not restricted to MA residents), so the trends would not be artificially increased by the improvement in state identification. As a result 2008 levels will differ from those reported earlier.
How Does ED Use Differ by Payer Category? Findings: • CommCare and Medicaid patients had a higher proportion of their ED visits considered preventable/avoidable compared to private payers, Medicare and the uninsured. There was little to no change in these proportions by payer over time. • There were significant differences across payers in the proportion of ED visits that were for mental health, or substance or alcohol abuse issues. These were also highest for Medicaid (8%) and CommCare (7%) patients, compared to less than 4% for private payers. • Although the total number of ED visits by Medicaid patients has increased while visits by the uninsured has declined since 2006 (because of increases in Medicaid enrollment and decreases in the volume of people who are uninsured), the proportion of preventable/avoidable visits has remained stable at 55% for Medicaid and 52% for the uninsured. • More than 6% of Medicaid ED patients were deemed frequent users, accounting for 26% of the ED visits by Medicaid patients. Fewer than 2% of the uninsured ED visitors were frequent users.
CommCare and Medicaid Patients Had Highest Proportion of their ED Visits Considered Preventable/Avoidable Preventable/avoidable visits as a proportion of the total ED visits for that payer, FY08 Fifty-five percent of ED visits by patients covered by Medicaid and CommCare were considered preventable or avoidable compared with 48% for Medicare and private payers and 52% for the uninsured. These proportions have changed little over time. Not surprisingly the “other” payers, which includes auto insurance and workers’ compensation, has a very low rate of preventable or avoidable ED visits because many of their visits result from traumatic injury. *All payers includes: workers’ compensation, other government payer, and auto insurance, which are likely to represent a high proportion of accidents and injuries. All Payers is the sum of all those with payer identifying information so it differs slightly from the statewide average. **Note: Private, Medicaid and Medicare Managed Care Plans are tracked under their respective payer category
CommCare and Medicaid Patients Had a Higher Percent of ED Visits for Mental Health/Substance AbuseMental health and substance and alcohol abuse visits as a proportion of the total ED visits for that payer, FY08 As with the preventable or avoidable ED visits, the proportion of ED visits that were for mental health and substance abuse issues was highest for CommCare and Medicaid. The percentage of ED visits for mental health and/or substance abuse was significantly lower (3.6%) for private payers. *All payer includes: workers’ compensation, other government payer, and auto insurance, which are likely to represent a high proportion of accidents and injuries.
More than a Fourth of ED Visits by Medicaid Patients Were Attributable to Frequent ED Users Frequent Users and Visits by Frequent Users by Payer Type, FY08 More than 6% of Medicaid ED patients were deemed frequent users, accounting for 26% of the ED visits by Medicaid patients. Medicare patients had the second highest proportion of frequent ED users. Fewer than 2% of the uninsured ED visitors were frequent users, making up 9% of ED visits for the uninsured. *Other payers are not included here. “Other payer” includes: workers’ compensation, other government payer, and auto insurance, which are likely to represent a high proportion of accidents and injuries. They have a negligible proportion of frequent users.
How Does ED Use Differ Regionally and for Designated Health Professional Shortage Areas? Findings: • Community Health Network Areas (CHNA) with the highest per capita rates of preventable/avoidable ED use had rates that were 3 to 5 times the CHNAs with the lowest rates. This could signal that there are substantial disparities among communities in primary care access and treatment. • Designated medically underserved populations (low income) consistently exhibited higher rates of preventable or avoidable ED visits compared to the state average. For some, Fall River, North Berkshire and Springfield, the rates were more than double the state average. This may indicate that socio-economic factors play a role in access to primary care. Only one area (Lowell) designated as a medically underserved population had a lower than average rate of preventable/avoidable ED visits. This is consistent with a lower rate found for the Greater Lowell Community Health Network Area. • Geographic areas designated as health professional shortage areas showed mixed results. Unlike socio-economic barriers (medically-underserved populations above), geographic barriers measured by distance from the nearest primary care provider alone may not be a significant driver of preventable or avoidable ED visits.
Health Improvement Goals of Community Health Network Areas (CHNA) • A community health network is a local coalition of public, non-profit, and private sectors working together to build healthier communities through community-based prevention planning and health promotion. The Massachusetts Department of Public Health established the CHNA in 1992 and it currently includes 27 areas comprising all 351 cities and towns in the state. • The goal of each CHNA is to promote community health planning through public-private partnerships involving hospitals, community health centers, local health officials, health and human service providers, business leaders, public safety officials, educators, clergy, and advocate. • Each of the 27 Community Health Networks collaboratively identifies local and regional health priorities, designs community-based prevention plans, and tracks success in achieving healthier communities • Considering their goals, the rate of preventable/avoidable ED visits in a given CHNA may provide valuable information to help identify, analyze and collectively prioritize health problems in the community. • The preventable/avoidable ED visit data can also contribute to a set of measurable outcomes to evaluate progress towards improved health in the CHNA. It should be recognized, however, that socio-economic factors in each region play a significant role. Source: Department of Public Health, Office of Healthy Communities
Community Health Network Areas: Per Capita Rates of Preventable/Avoidable ED Visits *The population based rates are the observed rates unadjusted for age, sex or socio-economic conditions Cities and towns that make up each CHNA can be found at: http://www.mass.gov/?pageID=eohhs2terminal&L=7&L0=Home&L1=Provider&L2=Guidelines+and+Resources&L3=Guidelines+for+Services+%26+Planning&L4=Health+Systems+%26+Workforce+Development&L5=Building+Healthy+Communities&L6=Community+Health+Network+Areas+(CHNA)&sid=Eeohhs2&b=terminalcontent&f=dph_healthy_comm_p_chna_config_contacts&csid=Eeohhs2 Population data for each CHNA were supplied by MA Department of Public Health Massachusetts Division of Health Care Finance and Policy - 28
Health Improvement Goals of Community Health Network Areas (CHNA)* • A community health network is a local coalition of public, non-profit, and private sectors working together to build healthier communities through community-based prevention planning and health promotion. The MA Dept. of Public Health established the CHNA in 1992 and it currently includes 27 areas comprising all 351 cities and towns in the state. • The goal of each CHNA is to promote community health planning through public-private partnerships involving hospitals, community health centers, local health officials, health and human service providers, business leaders, public safety officials, educators, clergy, and advocate. • Each of the 27 Community Health Networks collaboratively identifies local and regional health priorities, designs community-based prevention plans, and track success in achieving healthier communities • Given their goals, the rate of preventable/avoidable ED visits in a given CHNA may provide valuable information to help to identify, analyze and collectively prioritize health problems in the community. • The Preventable/Avoidable ED visit data can also contribute to a set of measurable outcomes to evaluate progress towards improved health in the CHNA. It should be recognized, however, that socio-economic factors in each region play a significant role. *Source: Department of Public Health, Office of Healthy Communities
Designated Health Professional Shortage Areas (HPSA) and Medically Underserved Populations (MUPs) • A geographic area is designated as having a shortage of primary medical care professionals (HPSA) if: • The area has a population to full-time equivalent primary care physician ratio of at least 3,500 to 1; or the area has a population to primary care physician ratio of less than 3,500 to 1 but greater than 3,000 to 1 and has unusually high needs for primary care services; and • Primary medical care professionals in contiguous areas are over-utilized, excessively distant, or inaccessible. • A population group is designated a medically underserved population (MUP) using a rating scale that takes into account: • Ratio of primary medical care physicians per 1,000 population, • Infant mortality rate, • Percentage of the population with incomes below the poverty level and • Percentage of the population age 65 or over. Population groups requesting MUP designation should be those with economic barriers (low-income or Medicaid-eligible populations) or cultural and/or linguistic access barriers. For more information seehttp://bhpr.hrsa.gov/shortage/hpsadesignation.htm
Medically Underserved Populations (MUPs) Consistently Associated with Higher Rates of Preventable/Avoidable ED VisitsRate of Preventable/Avoidable ED visits per 1,000 population in designated Medically Underserved Populations (MUPs), 2008 All but one designated underserved population area (due to low income) had a higher rate of preventable/ avoidable visits per 1,000 residents compared to the state average. In many cases, this higher rate also coincided with a higher rate for emergent visits for these areas, but in each case the proportion of all ED visits that were preventable/ avoidable was higher. Despite being designated a medically underserved population, Lowell had a lower rate of preventable/avoidable ED visits compared to the state. The Greater Lowell Community Health Network Area also showed a lower than average rate of preventable/avoidable ED visits. (see page 28). Lowell also has a larger and growing Asian population compared to the state average and all other low income areas depicted in this slide (17% compared to 4% in 2000*). The Asian population group is also associated with lower rates of preventable/avoidable and general ED use (see page 34). (LI) = Low income , (H)= Homeless Population numbers are based on Claritas, Inc.’s annual estimates. *Source: U.S. Census Bureau State and County QuickFacts http://quickfacts.census.gov/qfd/states/25/2537000.html
Geographic Barriers to Primary Care May Not Be a Significant Driver of Preventable/Avoidable ED VisitsRate of Preventable/Avoidable ED visits per 1,000 population in Health Professional Shortage Areas (HPSAs), 2008 The rates are unadjusted for socio-economic status. The areas listed represent geographic areas where it is determined that there is a low ratio of primary care physicians to population. Two of the designated HPSAs have a rate of preventable ED visits that is lower than the state average, while the other 4 areas have a higher rate. The rate in Nantucket is double the state average. There does not appear to be a consistent relationship between rates of preventable ED visits and geographic based primary care health provider shortage areas. This may mean that unlike the low-income designations shown earlier, geographic barriers to primary care access are not a strong driver of preventable/avoidable ED visits. Population numbers are based on Claritas, Inc.’s annual estimates.
How Does ED Use Differ by Patient Demographic (Race/Ethnicity, Age, and Gender)? Findings: • There were some substantial differences in ED utilization patterns among racial/ethnic groups. Hispanics and blacks, had the highest rates per capita of potentially preventable/avoidable ED visits, nearly 2.5 times the rate of whites. Although blacks and Hispanics also experienced somewhat higher rates of emergent ED visits, preventable/avoidable ED visits were disproportionately higher compared to whites. Both the rates of preventable/avoidable ED visits and emergent ED visits were substantially lower among the Asian population*. • Infants and children under age 5 had higher rates of preventable/avoidable ED visits compared to any other age group. A significant proportion of the ED visits for those under age 5 were fever related. Young adults ages 18-24 had the second highest rates of preventable/avoidable ED visits. It may be that young adults are less likely to establish and maintain a primary care provider relationship. • The per capita rate of preventable/avoidable ED visits was 20% higher for females when compared to males. *Note that these rates are not adjusted for socio-economic factors.
Blacks and Hispanics Experienced the Highest Preventable/Avoidable ED Visit Rates per Capita, FY08Rate of Preventable/Avoidable ED visits per 1,000 population The rates are not adjusted for socio-economic status. Hispanic and black ED visitors experienced the highest per capita rates of preventable/avoidable ED visits at 319 and 322 per 1,000--75% and 76% higher than the state average, respectively. Although the rates of emergent visits were also higher for blacks and Hispanics, preventable/avoidable visits were disproportionately higher. Asians had a much lower per capita rate of both preventable/avoidable and emergent ED visits. NH = Non-Hispanic. The population based rates are the observed rates unadjusted for age, sex or socio-economic status and are from Claritas, Inc.’s annual estimates. Massachusetts Division of Health Care Finance and Policy - 34
Infants and Children Under Age 5 Experience the Highest Rate of Preventable/Avoidable ED Visits per Capita, FY08Rate of Preventable/Avoidable ED visits per 1,000 population Infants and young children (age 0 to 4) had the highest per capita rate of preventable/avoidable ED visits--69% higher than the state average. A substantial proportion of these visits were for infant fever considered primary care treatable. The rate of preventable/avoidable ED visits for adults, ages 18 to 24, was also significantly higher than the state average. This age group makes up a large proportion of the newly insured and may have yet to establish primary care relationships. The population based rates are the observed rates unadjusted for age, sex or socio-economic factors and are from Claritas, Inc.’s annual estimates.
Females Had a Higher per Capita Rate of Preventable/Avoidable ED Visits than Males, FY08Rate of Preventable/Avoidable ED visits per 1,000 population The rate per 1,000 ED visits by females for preventable/avoidable conditions was higher than the state average by 10% compared to that of males, which is lower than the state average by 8%. The population based rates are the observed rates unadjusted for age, sex or socio-economic factors and are from Claritas, Inc.’s annual estimates.
Division of Health Care Finance and Policy Two Boylston Street Boston, MA 02116 Phone: (617) 988-3100 Fax: (617) 727-7662 Website: www.mass.gov/dhcfp Publication Number: 10-200-HCF-01