Download
1 / 46
460 likes | 640 Views
PRESENTING INFORMATION PEOPLE UNDERSTAND AND USE. Kathleen Cook, BSN Information & Fiscal Manager. CHALLENGE and STRATEGY. CHALLENGE. Produce easy to understand and timely information

E N D
PRESENTING INFORMATION PEOPLE UNDERSTAND AND USE Kathleen Cook, BSN Information & Fiscal Manager
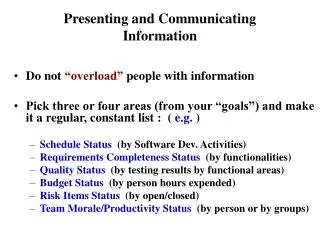
CHALLENGE • Produce easy to understand and timely information • Demands from public, decision-makers, political leaders, program staff and managers, funders and stakeholders, grantors • Pressure to show evidence-based practice outcomes • More data and data sources are available with little guidance for interpretation • Limited resources and staff to do the work
STRATEGY Principles to Guide Investments Support work at point of service Use standard, off-the-shelf technology Look for potential scalability Document for future • Key Elements • Systematic • Replicable • Easy to Use • Meaningful • Reliable, consistent and on-going sources of data • Comparable • Bench-marked • Related to Department mission, goals, objectives Make the time to develop strategic guide for IT investments and development
MANAGING THE DATA PRACTICAL AND STRUCTURED APPROACH
TYPES OF DATA PRESENTATION • Static Data • Periodic updates • BRFSS / YRBS • Hospital Discharge • Vital Statistics • Dynamic and Calculated Data • Near real time updates (Dynamic) • Collection of data, organized and pre-calculated • Point of service software (electronic medical/dental record; permit & inspection records) • Syndromic surveillance • Measures • Benchmarks • Performance indicators • Population health indicators • Process indicators • Analytics • Data / process mining • Statistical / predictive analysis • Reporting • Visualization • Graphs/charts • Dashboards • Alerts
Managing Static Data Staff gets new information in less than two weeks Standardize the process for each data source Create scripts and routines that can be run automatically Modify only when the data itself changes • Raw data • Analysis and Weighting • Survey data must be weighted based on sample size and demographics • Event data (e.g. births, deaths) must be adjusted when used for rates—particularly if cell size is less than 30 • After analysis and weighting, data are stored in SQL data base • If data change, new fields are created in the database We are saving atleast 500 hours of Epidemiology staff per data source From 1-2 datasets per year to 10 data sets
Managing Dynamic and Calculated Data Reliable Comparable Collaboration is critical Report Developers must work with Front end users who generate the data Managers who determine what is useful and or interpret the data Report Developers must also collaborate with Users of the Data Public Health leaders Stakeholders Partners Decision-makers Managers and Supervisors • Create a Structured approach to identifying and testing data to produce usable information • Identify routine process for linking data source to dashboard • Recognize and follow requirements from data owners related to privacy and access • Produce calculated data through routines Systematic Replicable
Dashboard Development and Deployment Our Health Department uses Dashboard Reporting Software from Logi Analytics
REPORT PROCESS All work starts with the Users: Managers and Frontline staff Identify Division / Program needs, indicators, benchmarks and other performance measures Collect Data Extract, Transfer and Load (ETL) the data to appropriate database Build Reports, dashboard and applications Verify that reports accurately represent the indicator or measure Publish
Updating Dashboard Applications • Updating the dashboard usually involves adding new data to the database • The dashboard is updated automatically. • Time spent on the initial design of the rules for Analysis, Weighting, Selection, Extraction, Transfer, and Load of data from each type of data source is the most intensive and important. • Assuring that the rules can replicated • Assuring that the rules can be automated • Assuring the rules can be systematically applied • Each additional use of the rules th
Using Dashboards Easy to Use Improving Public Health • Web-based deployment • No special software or training required • Users control what information they want to see, follow or monitor • Assure Quality Service & Performance • Promote Healthy Behaviors—Use of data to support and reinforce change • Monitor Community Health Status /Risks • Benchmark performance and measure outcomes
Promote Healthy Behaviors Use of data to support and reinforce change
Monitor Health Status Community Health Status Indicators Risk Indicators
Benchmark performance Measure outcomes Performance Measures and Indicators
Lessons Learned Things to Watch Out For….
Helping Users understand information We keep these points in mind and include explanations: • Taking care when using “percentage change” and rates for data sets with small cells. • When comparing years, the starting and ending years may not be reflective of the real change in values. • Know if there are breaks in the data: • Deaths classified using ICD 9 in 1998; ICD 10 in 1999 • Changes in birth certificates in 2005. • BRFSS: Changes in sampling as data collection using cell phone numbers increased led us to make a break between 2010 and 2011 data. We don’t display 2011 and 2012 data in direct comparison with 2010 and earlier data
Including confidence intervals and meta data • Age adjusted data can’t be compared if different standard populations are used (2000 is the usual standard, but sometimes a different year—say 1946 or 1970, is used). • Racial and ethnic definitions have changed in Census data for races and persons of Hispanic origin. • Don’t be overly precise—survey data have confidence intervals to consider.
GIS is powerful but ….. • GIS maps often raise more questions than they answer (counties next to each other may appear to have widely differing rates): • For cancer incidence, be careful, as cancer is age related and residential care and nursing homes are not located in all counties
Wrap up Best Practices Contacts
Best Practices / Model Practice LHDs and Electronic Health Records Webinar Why should your local health department (LHD) adopt and utilize electronic health records? Webinar that spotlights Lincoln-Lancaster County Health Department and Marion County Health Department use of electronic health records and how it has improved their public health practice. LLCHD Public Health Informatics Program Model Practice Program Award Winner: July 2011 Best Practices we used: Business Process Analysis Requirements Gathering Strategic Mapping and Planning Business Case
Questions ? / More information? Kathleen Cook Information & Fiscal Manager Lincoln-Lancaster County Health Department 3140 N Street Lincoln, NE 68510 402-441-8092 kcook@lincoln.ne.gov View some of our dashboards: http://data.publichealthne.org Developed with the Public Health Association of Nebraska for all Nebraska local health districts http://lincoln.ne.gov/city Key word: data Raju Kakarlapudi Public Health Epidemiologist Lincoln-Lancaster County Health Department 3140 N Street Lincoln, NE 68510 402-441-6270 rkakarlapudi@lincoln.ne.gov