Download
1 / 22
220 likes | 378 Views
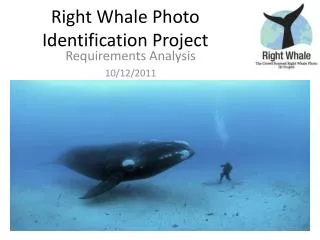
Predicting right whale distributions from space. Right whale, wrong time?. Threats to population Ship strikes Fishing gear All management options depend on knowing where whales are. 2. Story II: Whales follow food. Jan-Mar. Apr-May. On the habitat scale, whales follow food CCB:

E N D
Right whale, wrong time? • Threats to population • Ship strikes • Fishing gear • All management options depend on knowing where whales are 2
Story II: Whales follow food Jan-Mar Apr-May • On the habitat scale, whales follow food • CCB: • Other copepods early • Calanus briefly • Costa et al. (2006) • Pendleton et al. (2009) Calanus Others 3
Story II: Whales follow food • On the habitat scale, whales follow food • GSC: • Spring Calanus • Pendleton et al. (2009) 4
SST Chl RWPS 1.0 • SEASCAPE=Satellite-based Estimates and Analysis of Stage-resolved Copepod Abundance in Pelagic Ecosystems • Satellites can measure temperature and chlorophyll from space • Copepod growth and reproduction is related to temp & chl * = Adult C5 C1-4 nauplii 5
Developing the Model Calanus Abundance 6
Predicting Whales from Calanus Whale Arrival Date CLDG WBas EGoM MBay GSC CCB Frtn SS 60 80 Model Day 100 120 140 7
Predicting Whales from Calanus 110 Whale Arrival Date 90 70 20 30 40 Calanus Abundance Whale Arrival Date CLDG WBas EGoM MBay GSC CCB Frtn SS 60 80 Model Day 100 Whales arrive early when food is abundant 120 140 8
Summary • Presence and abundance of right whales is related to average copepod concentrations • Average copepods (Calanus) concentrations can be modeled • Goal for 2009: push to a finer scale, focus on Cape Cod Bay • high resolution physics from FVCOM • assimilate zooplankton observations with ensemble Kalman filter • build right whale habitat models with MaxEnt 9
RWPS 2.0 • 2009 focus on Mass Bay • Pseudocalanus, Centropages, Calanus • assimilating PCCS surveys using ensemble Kalman filter • available at seascapemodeling.org Pseudocalanus No assimilation January cruises Jan-Feb cruises 2/25/09 3/6/09 10
Right whale habitat models • Use 2003-2006 whale sightings to develop MaxEnt model • bathymetry 40.6 % • Calanus 23.8 • Pseudocalanus 14.5 • SST 12.3 • Chl (log10) 8.8 11
Right whale habitat predictions Jan 17 12
Right whale habitat predictions Jan 25 13
Right whale habitat predictions Feb 10 14
Right whale habitat predictions Feb 18 15
Right whale habitat predictions Feb 26 16
Right whale habitat predictions Mar 14 17
Right whale habitat predictions Mar 22 18
Right whale habitat predictions Mar 30 19
Right whale habitat predictions Apr 7 20
Right whale habitat predictions Apr 15 21
Next Steps • Evaluate/refine habitat maps • hindcast 1998-2009 • passive acoustic localizations • add data assimilation • Evaluate aerial survey procedures • arrival data forecasts for aerial survey boxes • adaptive sampling • direct plane/ship to areas of high uncertainty 22