Download
1 / 27
270 likes | 397 Views
The demographic development of Lithuania. Introduction.

E N D
Introduction Enduring several border changes, Soviet deportations, a massacre of its Jewish population, and German and Polish repatriations during and after World War II, Lithuania has maintained a fairly stable percentage of ethnic Lithuanians (from 79.3% in 1959 to 83.5% in 2002). Lithuania's citizenship law and the Constitution meet international and OSCE standards, guaranteeing universal human and civil rights.
Introduction In Lithuania like in other East and Central European countries, the demographic development during the last 10 years has been highly specific. During the last 10 years (1997-2007) Lithuania has lost 7.5% of its population. During every of these years, the number of emigrants exceeded the number immigrating and the number of deaths exceeded the births. At the start of year 2004, Lithuania's population numbered 3,445,900. The population losses are only partially offset by immigrants, principally from Russia, Belarus and Ukraine.
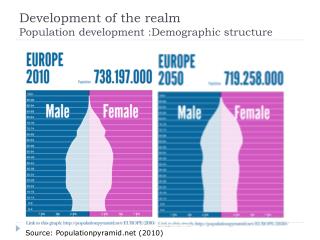
Population by age and sex Since the early 1990s, the new trends of all demographic processes – fertility, mortality, and migration – have significantly altered the age structure of the population. Since 1992, the proportion of elderly people has been clearly on the rise. During 1992–1999, the share of population aged 65 and over increased from 11.3% to 13.4%, while the share of children aged 0–14 dropped from 22.6% to 19.8%. The 15–64 age group experienced minor changes over the period, and in 1999, comprised 67%
Population by ethnic groups During the Soviet period Lithuania, in contrast to the neighboring Baltic countries, preserved its ethnic homogeneity. According to 1989 census data, shortly before the regaining of independence, Lithuanians constituted 79.6%, Russians 9.4% and Poles 7.0% of the population. The emigration of Slavic population, notably Russians, to the East, of the Jewish population to the West, and return of Lithuanians from the former USSR in the early 1990s have further increased the share of ethnic Lithuanians, who accounted for 81.6% of the total population at the beginning of 1997.
Among the Baltic states, Lithuania has the most homogeneous population. According to the census conducted in 2001, 83.45% of the population identified themselves as Lithuanians, 6.74% as Poles, 6.31% as Russians, 1.23% as Belarusian's, and 2.27% as members of other ethnic groups. Such a high percentage of ethnic Lithuanians might be influenced by the fact that in the early 1990s, the newly established government of Lithuania decided to grant citizenship to anyone who lived in Lithuania and who wished to have Lithuanian citizenship. Thus a number of people might have been assimilated. Poles are concentrated in the Vilnius region, the area controlled by Poland in the interwar period. Especially large communities of Polish minority in Lithuania are in Vilnius district municipality (61.3% of the population) and Šalčininkai district municipality (79.5%). Such concentration allows Election Action of Lithuania's Poles, an ethnic minority-based political party, to exert political influence. This party has held 1-2 seats in the parliament of Lithuania for the past decade. The party is more active in local politics and controls several municipal councils.
Russians, even though they are almost as numerous as Poles, are much more evenly scattered and lack a strong political party. The most prominent community lives in Visaginas city municipality (52%). Most of them are scientists who moved with their families from the Russian SFSR to work at the Ignalina Nuclear Power Plant. Lithuania is noted for its success in limiting Russian immigration during the Soviet period (1945-1990), in comparison to Latvia and Estonia. A number of ethnic Russians left Lithuania after the declaration of independence in 1990. In the past, the ethnic composition of Lithuania has undergone dramatic changes. The most prominent change is the extermination of the Jewish population during the Holocaust. Before World War II about 7.5% of the population was Jewish; they were concentrated in cities and towns and had a significant influence on crafts and business. They were called Litvaks and had a strong culture. The population of Vilnius, sometimes nicknamed Northern Jerusalem, was about 30% Jewish. Almost all of these Jews were killed during the Nazi Germany occupation, or later emigrated to the United States and Israel. Now there are only about 4,000 Jews living in Lithuania.
Births in Lithuania Infant mortality in Lithuania has been decreasing since 1993, and in 1999 it reached 8.6 for 1 000 of live births. The index is one of the lowest among other EU countries. The ratio of newborns of less than 2 500 gr. weight is lower in Lithuania than in other countries, being 4.5 percent in 1999, compared to 6.3 &end's; the average of EU countries in 1995. Perinatal mortality is also one of the lowest among EU countries.
Abortions The abortion index in Lithuania (number of abortions for 1 000 fertile women per year) is quite high: it was 33.7 in 1995, 29.9 in 1996, and 24.3 in 1997. This is actually a very urgent and painful problem after joining EU.
Mortality The mortality trends from the beginning of 1990s have revealed the negative mortality and health features (notably among males) that had shaped over the few previous decades (from the soviet time) and that are significantly different from the experience of the industrial countries both by their changes, the decisive factors and by the extent. Although since 1995 the mortality indicators have been improving in Lithuania , the male mortality rate is still higher than four decades ago. The mortality of Lithuanian population remains significantly higher than in the old European Union Member States and other industrial countries worldwide. In Lithuania , the life expectancy at birth of men is approximately ten years and women – five years shorter than in the old countries of the EU. Lithuania falls behind most of the new EU Member States by life expectancy of its population as well. Prevalence of unhealthy or even adverse to health behaviour, and of the environment, which hinders the formation of healthy life style attitudes and values, are the key factors responsible for the negative health and mortality trends. In the post-modern society these factors are playing an increasingly important role for improving the health and lowering the mortality.
Divorces With 3.2 divorces per every 1000 people, Lithuania in 2004 had the highest divorce rate in Europe. Divorces per 100 Marriages by Residential Area for Lithuania and Its Counties: 2002 had the highest number (108.7) of divorces per 100 marriages among the urban areas of all the counties, making that urban area the only one in the country where the number of divorces exceeded the number of marriages. Panevezys County had the highest number (59.5) of divorces per 100 marriages among the rural areas of all the counties. Over all areas, Vilnius County had the lowest number (54.9) of divorces per 100 marriages. Vilnius County also had the lowest number (58.2) of divorces per 100 marriages among the urban areas of all the counties. Alytus County had the lowest number (33.6) of divorces per 100 marriages among the rural areas of all the counties.
Population by marital status Aged 15 years and older, per cent Population by marital status Aged 15 years and older, per cent
The greatest changes in the matrimonial behavior are observed among young people born in the early 1970s (1971–1975). Only 30% of the men born in 1971 had married by the age of 24, whereas in all the older cohorts more than 60% had already been married by the age of 24. When the recent socio-economic changes had started, a considerable proportion of single men born in the late 1960s (1966–1970) had also postponed their marriage. Thus, at the age of 29, 75% of men born in 1966 were married, whereas in all the older cohorts about 85% of men had been married by the age of 29. In recent years, the behaviour of women concerning family formation has also changed significantly, however, in a different way than men. Two distinct groups of matrimonial behaviour may be seen. At present, a number of women marry very early in life, even earlier than before, and others postpone family formation to a later age. The results of the FFS have shown that young females who do not study or find employment upon finishing school marry much earlier, and they do not find a job after marriage. Possibly, in this manner a new social group of housewives, that did not and could not exist in the Soviet period of full employment, is being formed.
The spread of this phenomenon among young women might be a result of behaviour predetermined by the attitudes of personal self-expression. However, the fact that before marriage a sizeable proportion of these women were unemployed or laid off indicates that their decision and choice of life path might have also been influenced by the negative impact of social environment. Conversely, young women who pursue education and professional careers are in no hurry to marry. Only 53% of women born in 1971 had married by the age of 24, whereas over 70% of women in all the older cohorts had married by that age. "Ageing" of marriages that started at the beginning of the 1990s could signify the change in family timing, which is one of the fundamental features of family transformation to a modern pattern. Another indicator of this process in Lithuania is the spread of consensual unions.
Lithuanian Migration Migration, international as well as internal migration, is an important factor that affects the population of Lithuania. The Census of 2001 forced the recalculation of the annual population estimates for the intercensus period. Because of Lithuania’s relative precision in keeping birth and death records, the only place left where the Dept. of Statistics could adjust for the loss of over 200,000 people was in the international migration numbers.
Number of Religious Communities Number of Religious Communities 79.0% of Lithuanian population are Roman Catholics and 4.07% are of Orthodox faith. 14.86% profess no religion and the remaining 2.1%consider themselves followers of 19 different religious dominations. As of 1/1/04, there were 708 active R.C. churches and 774 R.C. priests.
Conclusions With the start of the economic transformations in Lithuania , the demographic processes (fertility, mortality, migration) have been undergoing essential changes, too. Fertility has dropped well below the level ensuring the replacement of generations. The family institute has been basically changing. Among the young people, a modern family pattern, with family making not related to marriage as one of its essential features, has been gaining strength. The level of mortality has been fluctuating. Contemporary mortality level of males is at a higher level than forty years ago. In migration, not only the trends, flows and volumes, but the dominant types have changed as well. Population ageing has been on the rise. For the first time in the peaceful period of Lithuania ’s history, the number of the Lithuanian population has been declining since the last decade of the 20th century.