Download
1 / 47
470 likes | 491 Views
This dissertation talk focuses on the measurement of the rate of muon capture in hydrogen gas and the determination of the proton's pseudoscalar coupling, including theory, experiment details, data analysis, results, and systematic effects analysis.

E N D
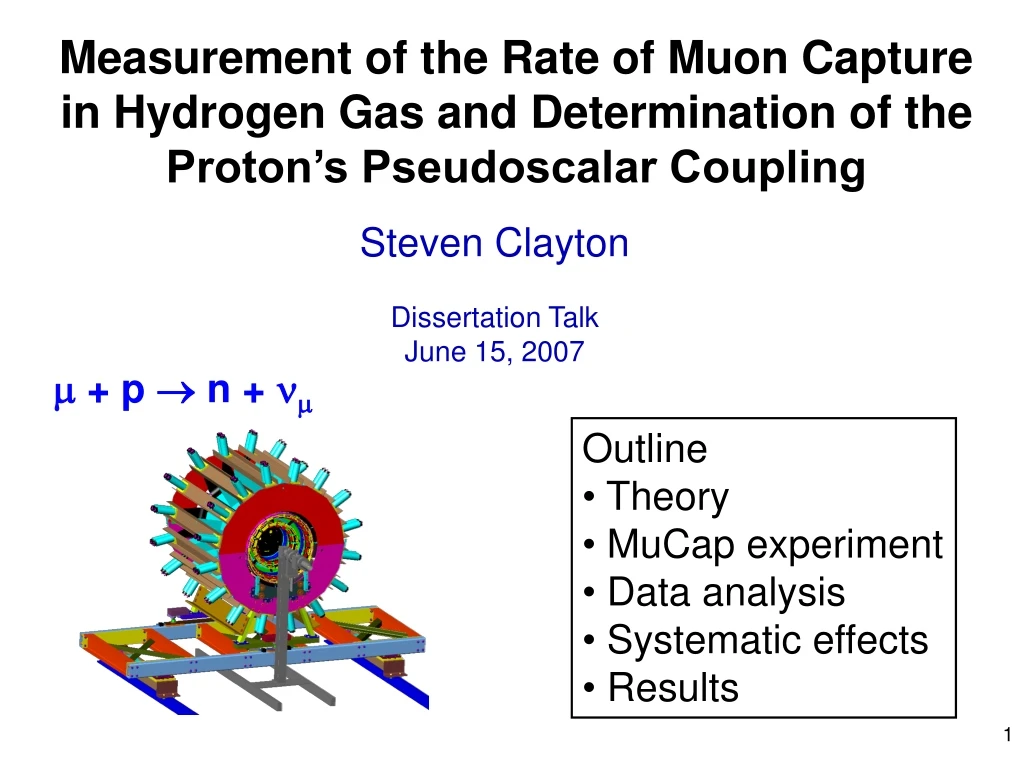
Measurement of the Rate of Muon Capture in Hydrogen Gas and Determination of the Proton’s Pseudoscalar Coupling + p n + Steven Clayton Dissertation Talk June 15, 2007 • Outline • Theory • MuCap experiment • Data analysis • Systematic effects • Results
m- Stopping in Hydrogen • Quickly forms a mp atom, transitions to ground state, transitions to singlet hyperfine state. Bohr radius a ≈ a0 me/mm≈ a0/200 • Most of the time, the m decays: • Occasionally, it nuclear captures on the proton: - m+ e- + nerate l0 1/tm+ BR≈0.999 - + p m+ n rate LSBR~10-3 - + p m+ n + g BR~10-8, E>60 MeV The goal of mCap is Ls to 1% precision: Ls = l - 1/tm+ Complications: molecular formation/transitions, transfer to impurity atoms, …
EM FF’s CVC = 0 n-decay Nucleon Form Factors nucleon level quark level G-parity
Phenomenological Calculation • Gives an expression in terms of form factors gV, gM, gA, gP. • W.f.s are solutions to the Dirac equation. • in bound state: • Non-relativisitic expansion to order vnucleon/c: • effective Hamiltonian in terms of “Primikoff factors” and Pauli matrices. • particle states in terms of 2-spinors ( • results in an explicit expression for the transition rate W: , total p spin dependence T = S = p() singlet p() triplet
gpNN n p p Fp W m- nm Pseudoscalar Form Factor gp gP determined by chiral symmetry of QCD: gP= (8.74 0.23) – (0.48 0.02) = 8.26 0.23 PCAC pole term Adler, Dothan, Wolfenstein ChPT leading order one loop two-loop <1%N. Kaiser Phys. Rev. C67 (2003) 027002 • solid QCD prediction via ChPT (2-3% level) • basic test of QCD symmetries Recent reviews:T. Gorringe, H. Fearing, Rev. Mod. Physics 76 (2004) 31V. Bernard et al., Nucl. Part. Phys. 28 (2002), R1
Sensitivity of S to Form Factors Contributes 0.45% uncertainty to S(theory) gpvs.S slope = -0.065 s (w/rad. corr.) Examples: gp 2.4% 13.6% 1.0% 6.1% 0.5% 3.8% S (s-1)
f = 1 (Liquid) f = 0.01 (~10 bar gas) Rel. Population Rel. Population Time after mp Formation Time after mp Formation Muon Atomic/Molecular State in Experiment must be known to connect with theory. Ls≈ 700 s-1 Lom≈ ¾ Ls Lpm≈ ¼ Ls mp(F=0) pmp(J=1) Ortho pmp(J=0) Para lppf lOP H2 density
MuCap Goal Previous Data on gp HBChPT (pp ortho-para transition rate) No common region of overlap between both expts. and theory gP basic and experimentally least known weak nucleon form factor
LT Ls Lom Lpm lppf lOP m- pmp(J=1) Ortho pmp(J=0) Para lpZcZ mp(F=0) lpdcd LZ ~ SZ4 mp(F=1) n + nm + (Z-1)* mZ md Ld Muon Atomic Transitions H2 must be pure isotopically and chemically: cd < 1 ppm, cZ < 10 ppb
Experimental Challenges 1) Unambiguous interpretation requires low-density hydrogen target. p diffusion into Z > 1 material. broad stop distribution stop distribution gas (1% LH2 density) liquid (LH2) 2) All neutral final state of muon captureis difficult to detect. It would require absolute calibration of neutron detectors.
slope = l≡ 1/t slope = l≡ 1/t Log Nevents S Sto 1% precision DT mCap Method: Lifetime Technique mCap measures the lifetime of m- in 10 bar Hydrogen. e- Data Acquisition H2 Telectron m- Tzero DT Repeat 1010 times for a 10 ppm precision lifetime measurement. Compare to + lifetime:
3D tracking w/o material in fiducial volume Time Projection Chamber (TPC) 10 bar ultra-pure hydrogen, 1% LH2 2.0 kV/cm drift field >5 kV on 3.5 mm anode half gap bakable glass/ceramic materials m Stop Side View Beam View y y m Beam z x
y x m- z Tracking in the Time Projection Chamber 1) entrance, Bragg peak at stop. 2) ionization electrons drift to MWPC. E p e- 3) projection onto zx plane from anodes and strips. 4) projection onto zy plane from anodes and drift time. 5) projection onto zy plane from strips and drift time.
strips anodes mCap Method: Clean Stop Definition Each muon is tracked in a time projection chamber. Data Acquisition Telectron e- H2 m- Only muons stopped well-away from non-hydrogen are accepted. Tzero DT
mCap Detailed Diagram • Tracking of Muon to Stop Position in Ultrapure H2 Gas • Tracking of Decay Electron
Commissioning and First Physics Data in 2004 (Target Pressure Vessel, Pulled Back)
Muon Definition • 2D clustering • stop identification • fiducial vol. cut time of signal arrival at MWPC (s) time of signal arrival at MWPC (s)
Electron Definition • timing from scintillator (eSC) • temporal and spatial • coincidences with wire • chamber planes: • full 3D tracking
Impact Parameter Cuts (also known as -e vertex cuts) e (electron view) interpolated e-track point of closest approach • stop position b m-e Vertex Cut m Stop Position aluminum pressure vessel The impact parameter b is the distance of closest approach of the e-track to the stop position.
Lifetime Spectra Normalized residuals (“pull”)
Internal corrections to - (statistical uncertainty of -: 12 s-1)
Gas impurities (Z > 1) are removed by a continuous H2 ultra-purification system (CHUPS). Commissioned 2004 cN2, cO2 < 0.01 ppm
In situ detection of Z > 1 captures Z>1 Capture (recoil nucleus) TPC (side view) m Beam Capture Time m Stop
The final Z > 1 correction Z is based on impurity-doped calibration data. Production Data Calibration Data (oxygen added to production gas) l Extrapolated Result 0 Observed capture yield YZ Lifetime deviation is linear with the Z>1 capture yield. Some adjustments were made because calibration data with the main contaminant, oxygen (H2O), were taken in a later running period (2006).
Internal corrections to - (statistical uncertainty of -: 12 s-1)
d Diffusion into Z > 1 Materials displacement (from - stop position) at time of decay d scattering in H2 (Monte Carlo) • Ramsauer-Townsend minimum in the scattering cross section • d can diffuse ~10 cm before muon decay, possibly into walls. • MuCap uses deuterium-depleted hydrogen (cd 1.5 ppm). • Residual effects are accounted for by a zero-extrapolation.
Production Data (d-depleted Hydrogen) Calibration Data (Natural Hydrogen) l Extrapolated Result 0 d Concentration (cd) Residual deuterium content is accounted for by a zero-extrapolation procedure. l from fits to data (f = Nle-lt + B) This must be determined.
diffusion “signal” for 40-mm cut cd(Production) cd(Natural H2) = 0.0125 ± 0.0010 *after accounting for p diffusion cd Determination: Data Analysis Approach • md can diffuse out of acceptance region: • signal proportional to number of md, and therefore to cd. (electron view) m Decay Position md Diffusion Path Fits to Lifetime Spectra natural hydrogen (cd 120 ppm) d-doped target (cd 17 ppm) production target (cd ~ 2 ppm) m-e Vertex Cut [s-1] m Stop Position Impact Parameter Cut bcut [mm]
Consistency Checks • lifetime vs. variations in parameters not expected to change the results
Lifetime vs eSC segment eSC Beam view of MuCap detector Sum over all segments
z y Example TPC fiducial volume shells (red areas) Lifetime vs. Non-Overlapping Fiducial Volume Shell outer inner outside the standard fiducial cut Included in standard fiducial cut inner outer
Lifetime vs. Chronological Subdivisions Oct. 9, 2004 Nov. 4, 2004
MuCap S from the lifetime molecular formation + decay rate bound-state effect Averaged with UCB result gives
LS Calculations and MuCap (2007) Result • rad. corrections • Czarnecki Marciano Sirlin (2006)R = 2.8% HBChPT HBChPT MuCap agrees within ~1s with LS theory
Updated gP vs. op (contributes 3% uncertainty to gpMuCap) • MuCap 2007 result (with gP to 15%) is consistent with theory. • This is the first precise, unambiguous experimental determination of gP
MuCap Collaboration V.A. Andreev, T.I. Banks, B. Besymjannykh, L. Bonnet, R.M. Carey, T.A. Case, D. Chitwood, S.M. Clayton, K.M. Crowe, P. Debevec, J. Deutsch, P.U. Dick, A. Dijksman, J. Egger, D. Fahrni, O. Fedorchenko, A.A. Fetisov, S.J. Freedman, V.A. Ganzha, T. Gorringe, J. Govaerts, F.E. Gray, F.J. Hartmann, D.W. Hertzog, M. Hildebrandt, A. Hofer, V.I. Jatsoura, P. Kammel, B. Kiburg, S. Knaak, P. Kravtsov, A.G. Krivshich, B. Lauss, M. Levchenko, E.M. Maev, O.E. Maev, R. McNabb, L. Meier, D. Michotte, F. Mulhauser, C.J.G. Onderwater, C.S. Özben, C. Petitjean, G.E. Petrov, R. Prieels, S. Sadetsky, G.N. Schapkin, R. Schmidt, G.G. Semenchuk, M. Soroka, V. Tichenko, V. Trofimov, A. Vasilyev, A.A. Vorobyov, M. Vznuzdaev, D. Webber, P. Winter, P. Zolnierzcuk Petersburg Nuclear Physics Institute (PNPI), Gatchina, RussiaPaul Scherrer Institute (PSI), Villigen, Switzerland University of California, Berkeley (UCB and LBNL), USAUniversity of Illinois at Urbana-Champaign (UIUC), USAUniversité Catholique de Louvain, BelgiumTU München, Garching, GermanyUniversity of Kentucky, Lexington, USABoston University, USA
Sensitivity of S to Form Factors Contributes 0.45% uncertainty to S(theory) gpvs.S slope = -0.065 s (w/rad. corr.) Examples: gp 2.4% 13.6% 1.0% 6.1% 0.5% 3.8% S (s-1)
Average HBChPT calculations of S: Apply new rad. correction (2.8%): gp from SMuCap = 725.0 17.4 s-1 (MuCap 2007, Final) Note: uncertainty in theory (~0.5%) not propagated.
Axialvector Form Factor gA Neutron Decay Experiments Axial radius Asymmetry Lifetime n+N scattering consistent with p electroproduction (with ChPT correction) PDG 2006 Severijns et al. (2006) RMP Bernard et al. (2002) Introduces 0.45% uncertainty to LS (theory)
b (obs.) b (ideal) p Diffusion Effect (electron view) Impact Parameter Distribution F(b) mp Diffusion Path m Decay Position early decays later decays bcut m-e Vertex Cut (bcut) m Stop Position b (mm) The effect is calculated based on: 1) the observed F(b), 2) a thermal diffusion model, 3) the requirement of consistency of the cd ratio vs. bcut (prev. slide). Later decays are less likely than early decays to pass the impact parameter cut.
b<12cm no b-cut b<12cm no b-cut All e accepted One e gated Lifetime vs. e-definition (treatment of detector planes) CathOR eSC Only CathAND CathAND CathAND CathAND CathOR CathOR eSC Only CathOR (impact par. cut) (e-multiplicity)
Lifetime deviations due to Z > 1 impurities can be calculated. Based on full kinetics solution: ye(t) Fit ye(t) to a single exponential or calculate first moment. Fit Function: f(t) = A exp(lt) Log Nevents Muon decay time t
Impurity correction scales with Z > 1 capture yield. Z = Z/YZ is similar for C, N, and O. We can correct for impurities based on the observed Z > 1 capture yield, if we know the detection efficiencyZ.
mCap Method: Clean Stop Definition Each muon is tracked in a time projection chamber. Data Acquisition e- Telectron H2 TPC m- … Tzero DT DT1 DT2 Only muons stopped well-away from non-hydrogen are accepted. DT3 0 < Ti < 22 s