Download
1 / 22
220 likes | 387 Views
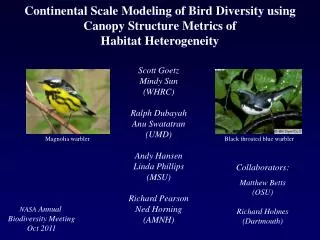
Continental Scale Modeling of Bird Diversity using Canopy Structure Metrics of Habitat Heterogeneity. Scott Goetz Mindy Sun (WHRC) Ralph Dubayah Anu Swatatran (UMD) Andy Hansen Linda Phillips (MSU) Richard Pearson Ned Horning (AMNH). Magnolia warbler. Black throated blue warbler.

E N D
Continental Scale Modeling of Bird Diversity using Canopy Structure Metrics ofHabitat Heterogeneity Scott Goetz Mindy Sun (WHRC) Ralph Dubayah Anu Swatatran (UMD) Andy Hansen Linda Phillips (MSU) Richard Pearson Ned Horning (AMNH) Magnolia warbler Black throated blue warbler Collaborators: Matthew Betts (OSU) Richard Holmes (Dartmouth) NASA Annual Biodiversity Meeting Oct 2011
Objectives / Research Questions (1) How can patterns of ecosystem structure be observed and modeled at regional to continental scales using remotely-sensed observations of canopy structure? (2) What is the influence of satellite measurements of canopy structure on biodiversity model predictions (extent, richness and abundance)? (3) What are the relationships between bird species richness, vegetation structure and ecosystem productivity at regional to continental-scales? ~ Summer Tanager. Photo by Scott Somershoe, USGS.
1) How can patterns of ecosystem structure be observed and modeled across scales using remotely-sensed observations of canopy structure? LVIS Canopy Height Oblique View Patuxent Wildlife Refuge, MD
2) What is the influence of satellite measurements of canopy structure on biodiversity model predictions (extent, richness and abundance)? At least 10 GLAS shots within BBS routes
National Breeding Bird Survey Species Stratified by Guild • 3700 active routes, 2900 surveyed annually • Each route is randomly located and 40km long • Table shows total number of birds for all routes in each habitat guild for 2006 • 688 species recorded
National Scale Predictors of Bird Diversity Patterns • Categories of predictors (see poster 161 for details) • Physical Environment: climate and topography • Vegetation Properties: canopy density / percent cover, functional groups, biomass • Vegetation Productivity: NPP, GPP (MODIS) • Vegetation Structure: GLAS metrics
Predictions of Bird Species Richness are Robust Open Woodland species Explained Variance = 59% All species Explained Variance = 56% 829 routes 781 routes Cross-validated with 10% reserved BBS routes Goetz et al. (forthcoming)
Forest Birds are predicted particularly wellEven in high Canopy Cover & Productivity areas All Forest Birds Explained Variance = 84% Cross-validated with 10% reserved BBS routes All 730 routes High Productivity Explained = 68% High Canopy Cover Explained = 63% High Canopy Cover routes (259) High productivity routes (389)
At the local scale Canopy Structure Matters.. we can even map multi-year habitat use.. Black throated blue warbler Hubbard Brook Experimental Forest Goetz et al. (2010) Ecology 91:1569-1576
Fusion with optical, hyper-spectral, hyper-resolution, SAR even better.. Hubbard Brook Experimental Forest 0 5 10 15 20 25 >30 m LVIS RH100 DRL Canopy Height 0 5 10 15 20 25 >30 m UAVSAR Landsat NDVI difference 0 0.6
Radar only All metrics Oven bird Prevalence < 2 2 – 4 4 – 6 6 - 9 Red eyed Vireo Black-throated Warbler Swatatran, Dubayah, Goetz, et al. (in press) PlosOne
Radar only All metrics Blackpoll Warbler Prevalence < 2 2 – 4 4 – 6 6 - 9 Magnolia Warbler Yellow Warbler Swatatran, Dubayah, Goetz, et al. (in press) PlosOne
Single versus multi-sensor predictions of Bird Species Richness % variance explained Hubbard Brook Experimental Forest Swatatran, Dubayah, Goetz, et al. (in press) PlosOne
Species habitat use varies with vegetation cover across a range of heights Ovenbird more prevalent in upper canopy Yellow-rumped warbler more prevalent in lower canopy
Predicting Abundance more difficult..Boosted Regression Tree Model predictions of species abundance at HBEF Average prediction… (mean r2 for 16 species = 0.38) Good prediction… Poor prediction… Magnolia Warbler, r2=0.71 Blackburnian Warbler, r2=0.383 Brown Creeper, r2=0.036
Summary of Findingsthus far.. • National scale bird species richness can be robustly predicted using a suite of environmental variables • At the national scale LIDaR canopy structure metrics are not selected as the most important variables • At local scale (HBEF, Patuxent) bird species richness and habitat use (multi-year prevalence) can be robustly predicted using lidar and multi-sensor canopy structure • Abundance more difficult
Next Steps & in Progress • Extend regional & national scale analyses across productivity, land use and disturbance gradients • Analyze SE LVIS transect data and intersections with BBS routes • We have made some progress on this..
3) What are the relationships between bird species richness, vegetation structure and ecosystem productivity at regional to continental-scales? Geographic regions differ in the slope of the species -productivity relationship Phillips et al. (2010) Ecological Applications
Southeast LVIS Transect Point Segment Route BBS stop locations Three analysis units Intersection of BBS routes with LVIS acquisitions
Regional Interactions among Ecosystem Productivity and Canopy Structure Geographic Location Southeast US BBS sample locations, Segments, Routes Three Analysis units Stratify Disturbance History and Land Use Response variable BBS species richness and diversity Predictor variables LVIS Canopy cover Canopy cover by height class Land cover Percent Ag Percent developed Percent Canopy Variety of cover types MODIS GPP VCF forest Soil fertility Other biophysical Temperature Precipiation Elevation NDVI
Stop locations and BBS route buffer LVIS transect overlap Collected GPS stop location data collected for 53 of 63 BBS routes from BBS Surveyor and/or driving the route GPS
Stop locations and BBS route buffer LVIS points in red BBS stop locations buffered (Red) BBS route buffered (Yellow)