Download
1 / 26
260 likes | 424 Views
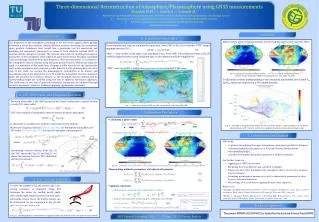
SMOS and Aquarius Inter-Comparison Over Oceans [and Land] Gary S.E. Lagerloef, Francois Cabot, Rajat Bindlish , Hsun -Ying Kao, Yann Kerr, Tom Jackson, Nicolas Reul , and Jordi Font. EGU 2013, 8-12 April 2013, Vienna Session OS4.9. Motivation and Outline. Motivation

E N D
SMOS and Aquarius Inter-Comparison Over Oceans [and Land] Gary S.E. Lagerloef, Francois Cabot, RajatBindlish, Hsun-Ying Kao, Yann Kerr, Tom Jackson, Nicolas Reul, and JordiFont EGU 2013, 8-12 April 2013, Vienna Session OS4.9
Motivation and Outline Motivation Quantify the inter-calibration biases between the sensors and the large-scale spatial and temporal systematic biases between the two satellites Outline/Approach • SMOS Level 1a data processed to polarized brightness temperatures (TH and TV) at the three Aquarius incidence angles (Cabot & Kerr) • SMOS Level 1c data, apply Faraday rotation, interpolate to Aquarius incidence angles and average over Aquarius footprint size (Bindlish and Jackson) • Inter-compare recent L3 mapped salinities: Aquarius V2.0, SMOS-BEC and SMOS-CATDS (Lagerloef, Kao, Font, Reul)
Introduction • Only active missions providing L-Band global measurements of brightness temperatures • Primary objectives are soil moisture and ocean salinity retrieval. Aquarius since June, 10th 2011 3 Stokes, incidences 29.3°, 38.4°, 46.2° 2.5 m reflector and feed horns Calibration based on internal noise diode and vicarious • Processing V2.0 SMOS since November, 2nd 2009 4 Stokes, incidences [0°,65°] Radiometric interferometer Calibration based on internal noise diodes and deep sky • 1st reprocessing data set
Antarctica around Dome Concordia Antarctic plateau around Dome C appears a very good candidate for stability monitoring and across fov consistency check On-ground measurement campaign took place in 2009, 2010 New campaign on-going SMOS Tb, H pol at 42.5° incidence, for the first 10 days of February 2010
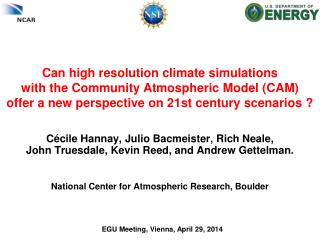
Long term stability over Antarctica SMOS V Aquarius V Both instruments show good long term stability Difference in sensitivity clearly evidenced Summer surface changes induce noisier behavior at V polarization Mean biases Aquarius H SMOS H
Aquarius co-locations Every 3 days, SMOS over flies Aquarius in 2 to 4 occasions Over 500 days in 2011-2012, over 750 co locations where selected Over fly: Seen from ground apparent distance less than 2.5°
SMOS-Aquarius comparison over all surfaces Collocations show slightly different trend from DomeC Main issue is dependency wrt Tbevidenced by selecting land only Accuracy is much lower because of surface heterogeneity Land only; Larger Biases
Methodology (Bindlish & Jackson) • Concurrent observations in both time (within 30 min → eliminates effect of change in physical temperature) and space (same location) • Aquarius and SMOS inter-comparison notes • Aquarius evaluation Version 2.0 • Period of record : August 25, 2011 – December 31, 2012 • Land and ocean • Concurrent SMOS and Aquarius observations within 30 min • Same incidence angle (after re-processing SMOS data) • Only alias free portions of SMOS observations • Multiple SMOS DGG locations within a single Aquarius footprint • Min number of SMOS observations per Aquarius footprint required– 20 (to minimize partial Aquarius footprint coverage) • Std. Dev. of SMOS data averaged < 5 K (land) and 1 K (ocean) (to minimize footprint variability; also results in screening RFI) • Differences in azimuth angle and orientation of the footprints ignored Rajat Bindlish and Tom Jackson, USDA
Comparison between Aquarius and SMOS Land Ocean Rajat Bindlish and Tom Jackson, USDA
Comparison between Aquarius and SMOS over Land Summary Statistics TB dTB 240-280 K 8 K (H) 260-300 K 6 K (V) Rajat Bindlish and Tom Jackson, USDA
Comparison between Aquarius and SMOS Rajat Bindlish and Tom Jackson, USDA
Comparison between Aquarius and SMOS over Ocean Summary Statistics • Summary of Aquarius-SMOS TB comparison at Aquarius incidence angles: • Land: Aquarius is biased warm ~6-11 K. • Likely to be a flaw in the antenna spillover correction which affects gain calibration, • to be corrected in next version. • Ocean: Aquarius is biased warm ~0-2.5 K. • Similar results obtain previously with Aquarius V1.3 • Why salinities agree much better is still not understood. Rajat Bindlish and Tom Jackson, USDA
Aquarius-SMOS Mapped Salinity • Aquarius L3 (data version V2.0) bin-averaged 1-degree resolution monthly maps • SMOS-BEC 0.25 degree bin-averaged monthly maps (ICM, Barcelona, J. Font), spatially averaged to 1-degree • SMOS CATDS0.25 degree bin-averaged monthly maps (IFREMER, Brest, N. Reul), spatially averaged to 1-degree • In all cases we analyze • Maps from Ascending, Descending and All orbits • Time period Sep2011 – Dec 2012 (16 months) • Difference maps plotted every 2nd month (8 per page) • Ascending – Descending reveals systematic errors for each • Differences between the three analyses (All orbits)
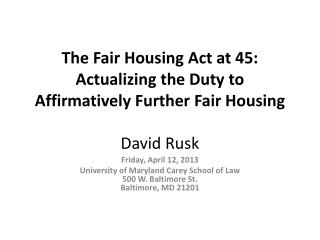
Ascending – Descending Analyses Ascending minus Descending orbits reveal the much about the systematic errors in the respective data sets. Findings: • Each data set shows strong Asc-Des patterns > 1psu amplitude. • They have a strong seasonal variation, with opposite signs from one part of the year to another. • SMOS BEC and CATDS patterns are similar, both differ substantially from Aquarius. • For Aquarius, most of the Asc-Des signature is related to the roughness dispersion of the galaxy reflection correction. • This is substantially reduced in the next version test-bed (presented by T. Meissner in this session)
All-Orbit Difference Analyses All-Orbit differences reveal large regional and global biases between the respective data sets. Findings: • Differences are similar magnitude as the individual Asc-Des patterns, > 1psu amplitude. • Seasonal variations are again evident, especially Aquarius - CATDS. • SMOS BEC and CATDS differences in 2012 are similar magnitude to differences of either one with Aquarius. • BEC-CATDS agree much better in 2011 (reprocessed data?) • Much of discrepancies are in higher latitudes, especially Southern Hemisphere.
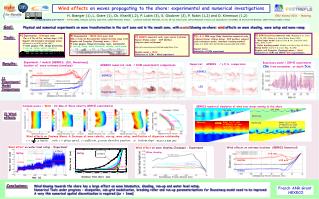
Directional consistency SMOS TBs exhibit Downward trend at low incidence low to medium spatial frequency oscillations Aquarius show warmer TBs at H pol and consistent directional signature DomeX (G. Macelloni) appears between SMOS and Aquarius Model and polynomial for reference only Hallikainenmodel (one layer, Tsnow=-54)
Comparison between Aquarius and SMOS • Aquarius Asc orbit corresponds to PM – SMOS Dsc orbit is PM • Aquarius Dsc orbit corresponds to AM – SMOS Asc orbit is AM • Each beam and polarization divided based on: • Aquarius trajectory • Whether Aquarius/SMOS observations are earlier • The following criterion was used to sub-divide the observations: • A. Aquarius Asc orbit with Aquarius overpass preceding SMOS overpass (30 min max) (occurs in the Southern Hemisphere for Asc orbit) • B. Aquarius Asc orbit with Aquarius overpass after SMOS overpass (30 min max) (occurs in the Northern Hemisphere for Asc orbit) • C. Aquarius Dsc orbit with Aquarius overpass preceding SMOS overpass (30 min max) (occurs in the Northern Hemisphere for Dsc orbit) • D. Aquarius Dsc orbit with Aquarius overpass after SMOS overpass (30 min max) (occurs in the Southern Hemisphere for Dsc orbit) Rajat Bindlish and Tom Jackson, USDA
Comparison between Aquarius and SMOS (V-pol, middle beam) Aquarius Asc (PM) Aquarius Dsc (AM) Aquarius preceding SMOS SMOS preceding Aquarius Rajat Bindlish and Tom Jackson, USDA