Download
1 / 10
100 likes | 304 Views
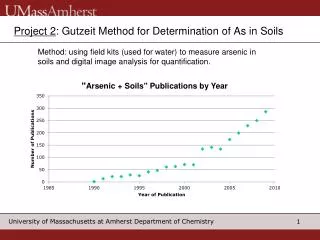
Project 2 : Gutzeit Method for Determination of As in Soils. Method: using field kits (used for water) to measure arsenic in soils and digital image analysis for quantification. Allowable Levels of Arsenic in Soils. Massachusetts: The allowable level is 20 mg kg -1 (ppm) in soil.

E N D
Project 2: Gutzeit Method for Determination of As in Soils Method: using field kits (used for water) to measure arsenic in soils and digital image analysis for quantification.
Allowable Levels of Arsenic in Soils Massachusetts: The allowable level is 20 mg kg-1 (ppm) in soil The Massachusetts DEP, www.mass.gov/dep/service/regulations/proposed/aisfindr.pdf, (accessed August, 2010)
Key Issues Surrounding Arsenic in Soil • Sources: • Naturally Occurring • Mining • Wood Treatments for Preservation • Bactericides, Fungicides, Pesticides and Insecticides • Areas of Concern: • Arsenic in soil is mobile into water and plant sources. • Is there bioaccumulation in rice? • What are the average concentrations in soil and rice? • Why is it more important to measure arsenic in soil than water? Quandt, S. A.; Jones, B.T.; Talton, J. W.; Whalley, L.E.; Galvan, L.; Vallejos, Q.M.; Grzywacz, J. G.; Chen, H.; Pharr, K.E.; Isom, S.; Arcury, T.A. Heavy metals exposures among Mexican farm workers in eastern North Carolina, Envir. Res.2010110, 83-88
The Soil, Rice and Water Connection • Average rice consumption between 400 and 650 g/day by typical adults in the arsenic-affected areas of Bangladesh, the intake of arsenic through rice stood at 0.20-0.35 mg/day. • Daily water consumption of 4 L drinking water, arsenic intake through drinking water stands at 0.2 mg/day. • Background arsenic concentration ranges from 2.35 to 0.18 mg kg-1 (ppm) in dry soil and from 50.6 to 0.03 mg kg-1 (ppm) in wetlands. Rahman, A.M.; Hasegawa, H.; Rahman, M. M.; Rahman, A. M.; Miah, M.M.; and Miah, M.A.M. Arsenic accumulation in rice (Oryza sativa L.): Human exposure through food chain. Eco. and Enviro. Safety, 2008, 69, 317-342 Chen, M., Ma, L.Q., Harris, W.G. Arsenic concentrations in Florida surface soils: Influence of soil type properties, Soil Sci. Soc. of Amer. J., 2002, 66, 632-640
Portable XRF Technology “Accurate, fast measurement of arsenic in the field remains a technical challenge. Technological advances in a variety of instruments have met with varying success. However, the central goal of developing field assays that reliably and reproducibly quantify arsenic has not been achieved.” Melamed, D. Anal. Chim. Acta,2005, 532, 1-13. • There is a spectral interference between Arsenic and Lead • Arsenic detection limit of 7 mg kg-1 (ppm) and Lead 13 mg kg-1 (ppm) • Cost: $25,000 Innov-A-Systems XRF Report on Detection Limit.http://www.equipcoservices.com/pdf/manuals/AsinSoilApp.pdf, (accessed February, 2010)
Plot of Blue Pixel Count Versus Concentration of Arsenic at Varied Mass Blue pixel count versus concentration of arsenic in mg kg-1 for five mass values at 1-20 reacted 20 minutes, 0.1 g (diamond), 0.5 g (square), 1 g (triangle), 5 g (x with a line), 10 g (x).
Plot of Blue Pixel Count Versus Concentration of Arsenic at 0.5 g soil and a Large Range of Concentrations at Different Times Plot of concentration of blue pixel value versus arsenic for 0.1 grams mass soil at 1-1000 mg kg-1 for four time periods; 1 hour(diamond), 45 min. (square), 30 min. (triangle), 20 min.(x).
Plot of Blue Pixel Count Versus Concentration of Arsenic at Varied Soil Mass and Time Plot of concentration of arsenic in mg kg-1 versus average blue values for 0.05 g mass soil at 1 to 1000 mg kg-1for four time periods, 20 min.(x), 30 min. (triangle), 45 min. (square), 1 hour (diamond)
Extraction of Arsenic from Soils with Different Solvent Plot of concentration of arsenic in mg kg-1 versus average blue values for 0.1 g mass soil at 20 to 1000 mg kg-1for three extracting solvents, sulfamic acid 1 M (blue diamond), phosphoric acid 1 M (red square), phosphoric acid 1 M at 24 hours (green triangles).
Future Work • Soils: experiment with a variety of soils containing wide ranges of particle distribution. • Solvents: use extraction procedures to determine if extraction enhances sensitivity. • Time: continue to investigate the relationship between time of exposure and ability to extract the metals from the soil matrix. • Kits: experiment with different manufacturer’s kits.