Pulsar Timing Analysis at Nanshan Radio Telescope: Glitches and Braking Index Variations
This study presents a detailed timing analysis of various pulsars, including the Crab pulsar, using the Nanshan Radio Telescope. A timing solution was developed focusing on the spin frequency and its derivatives. Significant glitches were detected in the Crab pulsar, including a new glitch in November 2011 and a notable large glitch in PSR J0631+1036. The Crab pulsar's braking index shows variability, measured at 2.571(3), indicative of changes in particle wind strength. This research contributes to understanding pulsar dynamics and gravitational wave detection.

Pulsar Timing Analysis at Nanshan Radio Telescope: Glitches and Braking Index Variations
E N D
Presentation Transcript
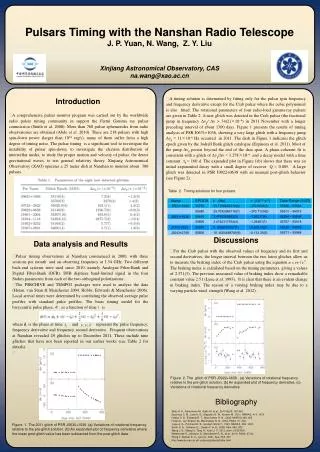
Pulsars Timing with the Nanshan Radio Telescope J. P. Yuan, N. Wang, Z. Y. Liu Xinjiang Astronomical Observatory, CAS na.wang@xao.ac.cn • A timing solution is determined by fitting only for the pulsar spin frequency and frequency derivative except for the Crab pulsar where the cubic polynomial is also fitted. The rotational parameters of four radio-loud gamma-ray pulsars are given in Table 2. A new glitch was detected in the Crab pulsar (the fractional jump in frequency Δνg/ Δν > 34(2)×10–9) in 2011 November with a longer preceding interval of about 1300 days. Figure 1 presents the results of timing analysis of PSR J0631+1036, showing a very large glitch with a frequency jump Δνg ≈ 11×10–6 Hz occurred in 2011. The dash in Figure 1 indicates the glitch epoch given by the Jodrell Bank glitch catalogue (Espinoza et al. 2011). Most of the jump Δνg persist beyond the end of the data span. A phase-coherent fit is consistent with a glitch of Δνg/Δν ≈ 3.278×10⁻⁶ and a decay model with a time constant τd ≈ 160 d. The expanded plot in Figure 1(b) shows that there was an initial exponential decay with a small degree of recover Q ≈ 0.005. A large glitch was detected in PSR J0922+0638 with an unusual post-glitch behavior (see Figure 2). • A comprehensive pulsar monitor program was carried out by the worldwide radio pulsar timing community in support the Fermi Gamma ray pulsar commission (Smith et al. 2008). More than 760 pulsar ephemerides from radio observatories are obtained (Abdo et al. 2010). There are 218 pulsars with high spin-down power (larger than 1034 erg/s), many of them suffer from a high degree of timing noise. The pulsar timing is a significant tool to investigate the instability of pulsar spin-down, to investigate the electron distribution of interstellar media, to study the proper motion and velocity of pulsar, the detect gravitational waves, to test general relativity theory. Xinjiang Astronomical Observatory (XAO) operates a 25 meter dish at Nanshan to monitor about 300 pulsars. Introduction Table 2. Timing solutions for four pulsars. Discussions Data analysis and Results • For the Crab pulsar with the observed values of frequency and its first and second derivatives, the longer interval between the two latest glitches allow us to measure the braking index of the Crab pulsar using the equation . The braking index is calculated based on the timing parameters, giving a values of 2.571(3). The previous measured value of braking index show a remarkable constant value 2.51 (Lyne et al. 1993). It is clear that there is an evident change in braking index. The reason of a varying braking index may be due to a varying particle wind strength (Wang et al. 2012). • Pulsar timing observations at Nanshan commenced in 2000, with three sessions per month and an observing frequency at 1.54 GHz. Two different back-end systems were used since 2010, namely Analogue Filter-Bank and Digital Filter-Bank (DFB). DFB digitizes band-limited signal in the four Stokes parameters from each of the two orthogonal polarizations. • The PSRCHIVE and TEMPO2 packages were used to analyze the data (Hotan, van Stran & Manchester 2004, Hobbs, Edwards & Manchester 2006). Local arrival times were determined by correlating the observed average pulse profiles with standard pulse profiles. The basic timing model for the barycentric pulse phase, , as a function of time is • where is the phase at time , and represent the pulse frequency, frequency derivative and frequency second derivative. Frequent observations at Nanshan revealed 49 glitches up to December 2011. These include nine glitches that have not been reported in our earlier works (see Table 2 for details). Figure 2. The glitch of PSR J0922+0638 . (a) Variations of rotational frequency relative to the pre-glitch solution. (b) An expanded plot of frequency derivative. (c) Variations of rotational frequency derivative. Bibliography Abdo A. A., Ackermann M., Ajello M. et al., 2010 ApJS, 187,460 Espinoza C. M., Lyne A. G., Stappers B. W., Kramer M., 2011, MNRAS, 414, 1679 Hobbs G. B., Edwards R. T., Manchester R. N., 2006, MNRAS,369, 655 Hotan A., van Straten W., Manchester R. N., 2004, PASA, 21, 302 Lyne A. G., Pritchard R. S., Graham Smith F., 1993, MNRAS, 265, 1003 Smith D. A., Guillemot L., Camilo F. et al., 2008, A&A, 492, 923 Wang J. B., Wang N., Tong H., Yuan J. P., 2012, arxiv: 1203.4291. Weltevrede P., Johnston S., Manchester R. N., et al., 2010, PASA, 27,64 Wong T., Backer D. C., Lyne A., 2001, ApJ, 548, 447 http://www.jb.man.ac.uk/~pulsar/glitches/gTable.html Figure 1. The 2011 glitch of PSR J0630+1036. (a) Variations of rotational frequency relative to the pre-glitch solution. (b) An expanded plot of frequency derivative where the mean post-glitch value has been subtracted from the post-glitch data.