Download

1 / 37
370 likes | 476 Views
Compare modern prostate cancer treatment methods objectively with expert insights to assess cancer control rates. This comprehensive review study analyzes 1,127 treatment articles published between 2000 and June 2013.

E N D
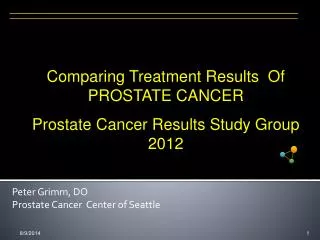
Peter Grimm, DO Prostate Cancer Center of Seattle Comparing Treatment Results Of PROSTATE CANCER Prostate Cancer Results Study Group 2014
Prostate Cancer Results Study Group Problem: Patients, physicians and carriers need a simple, unbiased means to compare the cancer control rates of modern prostate cancer treatment methods. 8/16/2014 2
Prostate Cancer Results Study Group To solve this problem, we have assembled experts from key treating disciplines: Surgery, External Radiation, Internal (or Brachytherapy), High Frequency Ultrasound, and Proton Therapy The purpose of this work is to do a complete review study of the current literature on prostate cancer treatment 8/16/2014
Prostate Cancer Results Study Group Ignace Billiet, MD F.E.B.U., Urologist Kortrijk, Belgium David Bostwick, MD Bostwick Laboratories David Crawford, MD Univ Colorado, Denver Brian Davis, MD Mayo Clinic Rochester, Minnesota Adam Dicker, MD Thomas Jefferson U Philadelphia,PA Steven Frank, MD MD Andersen, Houston Texas Peter Grimm, DO Prostate Cancer Center of Seattle Jos Immerzeel, MD De Prostaat Kliniek Netherlands Stephen Langley, MD St Luke's Cancer Centre, Guildford England Alvaro Martinez, MD William Beaumont , Royal Oak, Mi Mira Keyes, MD BC Cancer Agency , Vancouver Canada Patrick Kupelian, MD UCLA Med Center Los Angeles Robert Lee , MD Duke University Medical Center Stefan Machtens, MD University Bergisch, Gladbach Germany Jyoti Mayadev, UC Davis Davis ,California Brian Moran, MD Chicago Prostate Institute Chicago
Prostate Cancer Results Study Group Gregory Merrick, MD Schiffler Cancer Center Wheeling West Virginia Jeremy Millar, MD Alfred Health and Monash University, Melbourne Australia Mack Roach, MD UCSF San Francisco California Richard Stock, MD Mt. Sinai New York Katsuto Shinohara, MD UCSF San Francisco California Mark Scholz, MD Prostate Cancer Research Institute Marina del Ray California Edward Weber, MD Prostate Cancer Center of Seattle Anthony Zietman, MD Harvard Joint Center Boston Ma Michael Zelefsky, MD Memorial Sloan Kettering New York Jason Wong, MD UC Irvine California Robyn Vera, DO Radiant Oncology Lacey Washington
28,000+ prostate studies were published between 2000 and June 2013 1,127 of those studies featured treatment results 233 of those met the criteria to be included in this review study. (*1st & 2nd group) Some treatment methods are under-represented due to failure to meet criteria ABOUT THIS REVIEW STUDY
About This Study “Will I be cured?” or “Will my treatment make me cancer free?” are valid patient questions. However, PSA values (our best measurement tool today) cannot answer this absolutely. The current state-of-the-art can only indicate that the treatment was “successful” if PSA numbers do not indicate cancer progression.
About This Study After prostate removal, PSA numbers usually fall rapidly to very low numbers and stay low. After radiation, PSA numbers usually come down slower, might increase then fall in the 1 to 3 year range (called a “PSA Bump”), and then usually level out at a higher number than the surgery patient. These different PSA expectations result in dissimilar ways to review a man’s PSA history to judge treatment success. This study makes no attempt to standardize those evaluation systems.
Abbreviations Brachy = Seed implantation, either permanent or temporary seeds EBRT= External Beam Radiation Therapy includes IMRT = Intensity Modulated Radiation RP = Standard open radical prostatectomy Robot RP = Robotic Radical Prostatectomy HIFU = High frequency Ultrasound Cryo= Cryotherapy Protons = form of External Radiation using Protons ADT= Hormone Therapy
Criteria for Inclusion of Article* * Expert panel consensus Patients should be separated into Low, Intermediate, and High Risk Success must be determined by PSA analysis All Treatment types considered: Seeds (Brachy), Surgery (Standard or Robotic), IMRT (Intensity Modulated Radiation), HIFU (High Frequency Ultrasound), CRYO (Cryo Therapy), Protons, HDR (High dose Rate Brachytherapy) Article must be in a Peer Reviewed Journal 8/16/2014 10
Criteria for Inclusion of Article (cont.) 5. Low Risk articles must have a minimum of 100 patients 6. Intermediate Risk articles must have a minimum of 100 patients 7. High Risk articles, because of fewer patients, need only 50 patients to meet criteria 8. Patients must have been followed for a median of 5 years For additional criteria information contact: lisa@prostatecancertc.com 8/16/2014 11
% Articles Meeting Criteria Total of 1,127 Treatment Articles. Some articles addressed several treatments and were counted as separate articles for each treatment. *A few articles evaluated other/minor treatments and are not listed here. These calculations only include primary accepted articles, and do not include secondary acceptance totals. 8/16/2014 12
Each treatment is given a symbol. For example Seed implant alone (Brachy) is given a blue dot with a number in it. The number in the symbol refers to the article. The article can be found in the notes section below the slide ( go into “view” in up left corner of PowerPoint and click on note section, then click on this portion and scroll down to see all the references) Treatment Success % = Percent of men, whose PSA numbers indicate no cancer progression. (progression free) at a specific point in time The bottom line indicates the number years the study is out An example, the blue dot with 27 inside indicates that, as per article 27, 97% of the patients treated with seeds alone in low risk patients at 12 years were free of disease progression according to PSA numbers How to Interpret the Results 27
First Establish your clinical risk group* by looking at the definitions or ask your physician. Refer only to those slides for your risk group Make your own judgment and then ask a doctor in each discipline ( Seeds, External Radiation Surgery, etc) to tell you where his/her own peer reviewed publishedTreatment Success % would fit on this plot. How to Interpret the Results *Next Slide
LOWRisk Group Definition Low Risk Stage: T1 or T2a,b Gleason Sum < 6 PSA < 10 ng/ml
LOW RISK RESULTS % PSA Progression Free 113 14 8 110 27 25 13 4 22 37 35 6 114 3 33 32 10 39 103 31 29 101 112 28 111 EBRT & Seeds Treatment Success 115 16 18 102 24 36 5 105 19 2 26 12 40 Robot RP 1 100 106 7 107 104 9 108 15 20 109 17 7 CRYO HIFU 34 Protons ← Years from Treatment → HDR 11 109 • Prostate Cancer Results Study Group • Numbers within symbols refer to references Update of z Prostate Cancer Center of Seattle
LOW RISK RESULTS Weighted Brachy % PSA Progression Free 14 113 110 27 EBRT 25 13 8 4 22 37 35 6 114 3 33 32 10 39 103 111 31 29 101 112 28 115 16 18 EBRT & Seeds 102 24 36 5 105 19 2 26 12 40 1 100 Robot RP 106 7 107 104 9 108 15 Treatment Success 20 109 17 Surgery 7 CRYO HIFU 34 Protons ← Years from Treatment → HDR 11 109 • Prostate Cancer Results Study Group • Numbers within symbols refer to references Update of Prostate Cancer Center of Seattle
Question about the Criteria “The PCRSG criteria is pretty strict and not a lot of studies fit. What happens if you include articles with only 40 months of follow up or have a long follow up but less than 100 patients?”
LOW RISK RESULTS >40 months follow-up or less than 100 patients % PSA Progression Free 68 51 50 46 97 96 113 14 Seeds & ADT 110 27 66 25 + 22 13 8 48 4 75 62 37 201 81 44 86 35 6 114 3 82 EBRT & ADT 60 69 41 71 33 32 10 203 n 65 85 39 103 98 111 84 31 72 99 29 101 112 28 67 Treatment Success 89 42 94 95 16 61 93 18 88 EBRT& Seeds 102 24 73 54 36 5 105 19 47 78 43 2 26 12 64 55 52 40 83 202 58 Robot RP 1 100 87 106 7 107 76 56 104 77 9 108 70 80 41 15 45 57 74 79 20 59 109 17 53 90 CRYO 63 HIFU 7 34 Protons ← Years from Treatment → Hypo EBRT 91 49 HDR 11 • Prostate Cancer Results Study Group • Numbers within symbols refer to references Update of Prostate Cancer Center of Seattle
LOW RISK RESULTS Weighted >40 months follow-up or less than 100 patients EBRT Brachy % PSA Progression Free 68 51 50 46 92 96 113 14 Seeds & ADT 110 97 27 66 25 + 22 13 8 48 4 75 62 37 201 81 44 86 35 6 114 3 82 EBRT & ADT 60 69 41 71 33 32 10 203 65 85 39 103 Treatment Success 111 84 31 72 99 29 101 112 28 67 98 89 42 94 95 115 16 61 93 18 88 EBRT& Seeds 102 24 38 73 54 36 5 105 19 47 78 43 2 26 12 64 55 52 40 83 202 58 Robot RP 1 100 87 106 7 107 76 56 104 77 9 108 70 80 41 15 45 57 74 79 20 59 109 Surgery 17 53 90 CRYO 63 HIFU 7 34 Protons ← Years from Treatment → Hypo EBRT 91 49 HDR 11 • Prostate Cancer Results Study Group • Numbers within symbols refer to references Update of Prostate Cancer Center of Seattle
Intermediate Risk Patient Definition Zelefsky definition Only 1 factor Clinical Stage T2c Gleason score > 7 PSA > 10 ng/ml D’Amico definition PSA 10-20 Gleason Score 7 or Stage T2b
INTERMEDIATE RISK RESULTS % PSA Progression Free EBRT + ADT 24 Robot RP 13 23 37 14 35 49 156 158 Seeds + ADT 151 34 + 153 44 161 15 40 Treatment Success 16 4 EBRT & Seeds 38 160 36 45 30 25 27 39 152 31 156 6 12 Hypo EBRT 42 32 160 43 47 17 18 Seeds Alone 157 28 150 5 26 9 157 155 7 152 159 29 41 154 1 48 32 2 8 19 10 33 11 46 20 HDR 155 ← Years from Treatment → EBRT, Seeds + ADT 21 Protons 22 • Prostate Cancer Results Study Group • Numbers within symbols refer to references Update of Prostate Cancer Center of Seattle
INTERMEDIATE RISK RESULTS Weighted EBRT & Seeds Brachy % PSA Progression Free 24 Robot RP 13 23 37 14 35 49 158 156 Seeds + ADT 151 34 + 153 44 161 15 40 16 4 EBRT & Seeds 38 160 30 36 45 25 27 39 152 31 6 12 Hypo EBRT 42 32 156 3 43 160 47 17 18 Seeds Alone 28 150 5 26 9 Treatment Success 157 155 152 7 41 29 159 154 1 48 32 2 8 10 19 33 11 46 EBRT Surgery 20 HDR 155 EBRT, Seeds + ADT ← Years from Treatment → 21 Protons 22 • Prostate Cancer Results Study Group • Numbers within symbols refer to references Update of Prostate Cancer Center of Seattle
Favorable vs Unfavorable* Intermediate Risk *Zumsteg et al (MSKCC) New Risk Classification system for therapeutic decision making PCA pts undergoing dose escalated EBRT European Urology 64 p 895-902 2013 Favorable vs Unfavorable • Favorable • Single feature • Gleason 3+4=7 • < 50% of biopsy cores + • Unfavorable • All other Intermediate
INTERMEDIATE RISK Favorable Vs Unfavorable* Weighted EBRT & Seeds Brachy % PSA Progression Free 24 Robot RP 13 23 37 14 35 49 156 158 Seeds + ADT 151 34 + 153 44 15 40 16 4 EBRT & Seeds 38 160 30 36 45 25 F33 39 152 31 6 12 Hypo EBRT 42 156 32 3 43 160 47 27 17 18 Seeds Alone 28 150 5 26 9 Treatment Success 157 155 152 7 41 U33 29 159 154 1 48 32 2 8 10 19 11 46 EBRT Surgery 20 HDR 155 EBRT, Seeds + ADT ← Years from Treatment → 21 Protons 22 • Prostate Cancer Results Study Group • Numbers within symbols refer to references Update of Prostate Cancer Center of Seattle
INTERMEDIATE RISK RESULTS >40 months follow-up or less than 100 patients % PSA Progression Free EBRT + ADT 54 56 59 104 24 Robot RP 13 59 66 55 23 37 14 79 35 49 156 59 158 92 98 Seeds + ADT 151 34 + 153 161 15 44 96 40 Treatment Success 57 16 4 EBRT & Seeds 38 109 30 160 36 68 69 58 45 25 99 77 105 27 12 39 83 152 31 107 82 97 6 73 Hypo EBRT 156 42 106 108 51 91 3 64 32 160 43 72 47 62 63 93 86 71 17 Seeds Alone 18 50 81 95 28 150 74 67 90 26 5 9 52 157 78 65 155 152 70 7 103 102 29 41 159 76 154 60 100 1 48 32 110 2 85 88 53 8 87 10 19 33 75 101 11 46 84 94 89 20 HDR 155 EBRT, Seeds + ADT ← Years from Treatment → 21 Protons 80 22 • Prostate Cancer Results Study Group • Numbers within symbols refer to references Update of Prostate Cancer Center of Seattle
INTERMEDIATE RISK RESULTS weighted >40 months follow-up or less than 100 patients Brachy % PSA Progression Free EBRT + ADT 54 56 59 104 24 Robot RP 13 66 55 23 37 14 EBRT 79 35 49 158 156 92 98 Seeds + ADT 151 34 + 153 161 15 44 96 40 EBRT & Seeds 57 16 4 38 109 36 68 69 58 30 45 25 99 77 12 39 83 152 27 31 105 107 82 97 6 73 Hypo EBRT 42 156 108 51 91 3 64 160 43 72 47 62 63 93 86 71 17 Seeds Alone 18 50 81 95 28 150 74 67 90 26 5 9 52 157 78 65 Treatment Success 155 152 70 7 103 102 29 41 159 76 154 60 100 1 48 32 110 2 85 88 53 8 87 10 19 75 101 11 46 84 94 Surgery 89 20 HDR 155 EBRT, Seeds + ADT ← Years from Treatment → 21 Protons 80 22 • Prostate Cancer Results Study Group • Numbers within symbols refer to references Update of Prostate Cancer Center of Seattle
High Risk Patient Definition Zelefsky definition 2 or more factors Gleason > 7 PSA 10-20 Clinical Stage T1c- T2b D'Amico Gleason Score 8-10 PSA >20
HIGH RISK RESULTS % PSA Progression Free Surg & EBRT 20 16 109 4 Surg & ADT 19 18 108 EBRT & ADT 112 32 22 Treatment Success 17 136 EBRT & Seeds 122 123 131 40 112 44 37 125 3 43 47 Hypo EBRT 124 127 34 135 9 2 41 104 125 128 48 10 13 114 134 42 24 28 1 12 8 132 136 25 133 32 110 36 101 9 106 5 113 21 111 45 33 120 120 120 126 118 14 121 39 119 117 115 26 11 31 103 7 6 130 35 Protons 116 36 30 27 46 107 HDR 15 102 105 EBRT Seeds + ADT 29 23 ← Years from Treatment → 49 Robot RP Hypo EBRT +ADT • Prostate Cancer Results Study Group • Numbers within symbols refer to references HDR + ADT Update of Prostate Cancer Center of Seattle
HIGH RISK RESULTS Weighted EBRT, Seeds & ADT % PSA Progression Free Brachy Surg & EBRT 20 16 109 Surg & ADT 4 19 18 108 EBRT & ADT 112 22 32 123 17 136 EBRT & Seeds 122 131 40 112 44 37 125 3 43 47 Hypo EBRT 124 127 34 135 9 2 125 41 104 128 48 10 13 114 134 42 24 28 1 12 8 132 136 25 133 Treatment Success 32 110 36 101 9 106 5 113 21 111 45 33 120 120 126 118 14 121 119 39 Surgery 117 115 26 11 31 EBRT 103 7 6 130 35 Protons 116 36 30 27 46 107 HDR 15 102 105 EBRT Seeds + ADT 29 23 ← Years from Treatment → 49 Robot RP HDR + ADT • Prostate Cancer Results Study Group • Numbers within symbols refer to references Update of Prostate Cancer Center of Seattle
HIGH RISK RESULTS >40 months follow-up or less than 100 patients % PSA Progression Free Surg & EBRT 92 65 20 16 109 81 99 94 4 Surg & ADT 19 18 80 108 74 EBRT & ADT 112 78 22 32 123 Treatment Success 17 136 67 122 EBRT & Seeds 131 55 40 75 112 44 37 125 3 72 85 43 76 47 Hypo EBRT 124 127 60 54 34 9 135 91 41 2 66 104 125 79 68 57 128 48 71 64 59 13 10 42 24 28 50 56 1 12 8 132 134 114 136 53 25 61 89 90 110 133 36 101 9 5 113 21 111 23 62 106 33 93 32 120 120 126 118 14 121 119 70 39 119 45 97 95 117 115 26 11 98 103 83 82 31 7 6 96 130 35 Protons 52 63 84 116 73 58 30 27 46 36 77 107 HDR 86 87 15 102 88 105 51 EBRT Seeds + ADT 29 ← Years from Treatment → 49 69 Robot RP HIFU • Prostate Cancer Results Study Group • Numbers within symbols refer to references HDR + ADT Update of Prostate Cancer Center of Seattle
HIGH RISK RESULTS Weighted >40 months follow-up or less than 100 patients Brachy % PSA Progression Free Surg & EBRT 92 65 20 16 109 81 Surg & ADT 99 94 4 19 18 80 108 74 EBRT & ADT 112 32 78 22 123 Treatment Success 17 136 67 EBRT & Seeds 122 123 131 55 75 112 40 44 37 125 3 72 85 43 76 47 Hypo EBRT 124 127 60 54 34 135 9 91 66 2 41 104 125 79 68 57 134 128 10 48 71 59 64 114 13 42 24 28 50 56 1 12 8 132 136 53 25 61 133 90 89 32 110 36 101 EBRT 9 5 113 21 111 62 106 33 93 120 126 118 14 95 45 119 70 39 98 96 31 115 26 11 103 83 82 7 6 130 35 Protons 52 63 84 36 116 30 73 58 27 46 77 HDR 107 86 87 15 102 88 105 51 EBRT Seeds + ADT Surgery 29 23 ← Years from Treatment → 49 69 Robot RP HIFU • Prostate Cancer Results Study Group • Numbers within symbols refer to references HDR + ADT Update of Prostate Cancer Center of Seattle
OBSERVATIONS For most low risk patients, most therapies will be successful. There appears to be a higher cancer control success rate for Brachy over EBRT and Surgery for all groups. Patients are encouraged to look at graphs and determine for themselves Serious side effect rates must be considered for any treatment Relaxing the report selection criteria doesn’t seem to impact the results substantially 8/16/2014 33
Slide Symbols & Abbreviations = Seeds alone = EBRT & Seeds = Surgery = Standard Radical Prostatectomy = “Robot” =Robotic Prostatectomy = “HIFU” = High Frequency Ultrasound = “HDR”= High Dose Rate Brachytherapy +/-EBRT = EBRT alone = Hypo EBRT = Protons
Slide Symbols & Abbreviations (cont.) = “CRYO” Cryo Therapy = EBRT, Seeds, & ADT = Seeds & ADT = EBRT & ADT = Surgery & ADT = “Brachy” = all seed implant treatments = all Surgery treatments = all EBRT treatments = all EBRT & Seeds = all EBRT, Seeds & ADT +
Risk Group Definitions Low Risk Stage: T1 or T2a,b Gleason Sum < 6 PSA < 10 ng/ml • Intermediate Risk • Stage T1 or T1-2 Stage T1-2 • Gleason Score 7 or Gleason 6 • PSA < 10 PSA 10-20 High Risk Stage T2c or T3 Gleason score ≥ 8 PSA > 20 ng/mL
For More Information Peter Grimm, DO peter@grimm.com Lisa Grimm, Research Coordinator lisa@prostatecancertc.com Or ProstateCancerTC.com Or contact PCRSG member Prostate Cancer Center of Seattle website www.Prostatecancertreatmentcenter.com