Download
1 / 30
300 likes | 435 Views
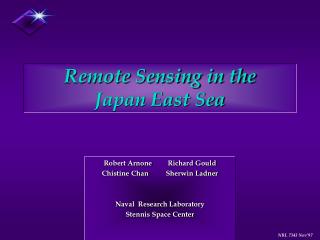
Remote Sensing in the Japan East Sea. Robert Arnone Richard Gould Chistine Chan Sherwin Ladner Naval Research Laboratory Stennis Space Center. Objective:. Establish the seasonal and regional character of the SST and Bio-Optical (Chlorophyll) distribution (i.e. time -series)

E N D
Remote Sensing in the Japan East Sea Robert Arnone Richard Gould Chistine Chan Sherwin Ladner Naval Research Laboratory Stennis Space Center
Objective: • Establish the seasonal and regional character of the SST and Bio-Optical (Chlorophyll) distribution (i.e. time -series) • AVHRR / SeaWIFS • GAC /and LAC (resolution) • Coupling of the temperature and bio-optical structure (physical) • on the Subpolar front/ • Korean Coastal Current • Determine link of the surface features with subsurface • Real –time satellite imagery (AVHRR and SeaWIFS ) • for directing SeaSoar • SeaWIFS validation. CRUISE ONE RESULTS – SEASOAR – May /June 1999
Status of Remote Sensing AVHRR - - HRPT (1 km) daily imagery -NOAA – LAC 1998/1999 limited - Shipboard system - KORDI – HRPT – (ftp) - July - 1999 - Japan Ischio Asamasi total 1998 – 227 total 1999 – 384 total of 611 - GAC (Monthly) -Phy O DACC (JPL) SeaWIFS - HRPT (1 km) - Goddard (SeaWIFS project) - Ship board system - GAC (monthly) – SeaWIFS project
May. 21, 1999 SST Eddy Scales 25-35 km 40-50 km Upwelling 100-120 km Coastal Upwelling Roll um’ Filament
AVHRR- SeaWIFS Monthly 1998 - 1999 Movie Gac SeaWIFS Monthly 1998- 1999 Movie AVHRR Monthly 1998- 1999 Movie AVHRR Weekly 1999 Movie SeaWIFS Weekly 1998 Movie SeaWIFS Weekly 1999 Movie AVHRR Weekly 1998 Movie AVHRR Daily 1998- 1999 Movie SeaWIFS Daily 1998- 1999 Movie
Time-Series Analyses AVHRR – SST SeaWIFS – Chlorophyll Nov 1997 - Oct 1999 SeaWIFS Monthly Composite 4- 99 ! Residuals AVHRR Monthly Composite 4- 99 Russia China Korea Japan 130 140
Basin Time Series Gac Imagery 1997 1998 1999 Spring Bloom Fall Bloom Spring Bloom SST
Latitude Binned Seasonal progression of SST and Chlorophyll Sea Surface Temperature (AVHRR -GAC) Chlorophyll (SeaWIFS - GAC) Fall Bloom Fall Bloom Spring Bloom Spring Bloom 1997 1998 1999 1998 1997 1999
Regional Time- Series Weekly Composites North Basin North Basin SubPolar Front SubPolar Front South Basin South Basin
Time Series Analyses AVHRR WEEKLY (HRPT) SeaWIFS
Differences in SST and Chlorophyll March 24, 1998 Julian: 083 Sea Surface Temperature Chlorophyll
March 31, 1998 AVHRR - SST SeaWIFS -CHL
Bio-Optics Cruise results: Stations NRL Reflectance CTD Atmospheric Sounding SubPolar Front Cruise track SST 21 May, 1999 May - June 1999 Stations 40 ASD – remote sensing reflectance ac9 – flowthrough (10 sec) Sun Photometer (80) - Shipboard receiving – 200 AVHRR - 25 SeaWIFS
East Sea Cruise, HNRO05 19 May - 3 June, 1999 ASD Station Locations 25 14 11,17 24 18,19 13 20 23 12 10,16 15 9 26 27 21,22 30 29 28 4 2 6 7 36 5 37 3 8 38 39 31 32 5 33 34 35 40 1 33 11
East Sea -- Thermal/Bio-Optical Relationships • Define region of interest • Extract ROI pixels from SST (AVHRR) and chlorophyll (SeaWiFS) imagery - daily scenes and monthly composites • Examine thermal/bio-optical relationships (scatter plots, image overlays) • Examine temporal and spatial changes (time-series analysis, histograms) North Basin Subpolar Front South Basin Korean Coast
Subpolar Front -- May 21, 1999 AVHRR and SeaWiFS Collected ~ 6 hrs apart CHL CHL > 2.0 g/l Chlorophyll CHL > 2.0 g/l SST SST Chlorophyll SST SST
AVHRR SST May 21, 1999 AVHRR SST May 21, 1999 Cruise track AVHRR SST 12 14 16 ShipFlow Through 12 14 16
SeaWIFS Absorption 440 (Arnone) 0.10 0.2 0.3 SeaWIFS (atotal 440) 0.10 0.2 .3 Flowthrough (atotal 443)
SeaWIFS (bb550) Flowthrough b550
April 25, 1999 Week 17
Summary • Time series of AVHRR- SST and SeaWIFS Bio-optics • Movie Loops • Seasonal and regional trends • Spring / Fall Blooms • Eddy Fields – scales • Complex SST / Chlorophyll linking • May Seasoar Cruise – • Optical properties / absorption/ scattering and RRS • Characterization of SeaWIFS IOP
Korean Coast -- May 21, 1999 CHL SST SST SST CHL > 2.0 g/l CHL > 2.0 g/l Chlorophyll SST SST SST
Subpolar Front -- April, May, June, 1999 SST April 21, 1999 CHL > 2.0 g/l CHL > 2.0 g/l Chlorophyll SST May 21, 1999 Chlorophyll SST June 9, 1999 Chlorophyll SST
0.06 0.15 0.25 Japan East Sea COMPARISONS 10 iterations 0.06 0.15 0.25 No iteration Decreased Chlorophyll Values