Download
1 / 34
340 likes | 453 Views
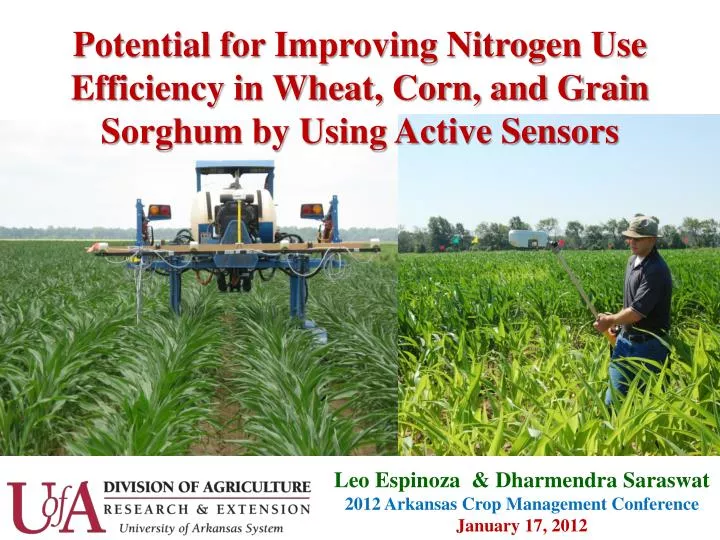
Potential for Improving Nitrogen Use Efficiency in Wheat, Corn, and Grain Sorghum by Using Active Sensors. Leo Espinoza & Dharmendra Saraswat 2012 Arkansas Crop Management Conference January 17, 2012. Presentation Outline. Need Basics of Optical Sensing Operational Details

E N D
Potential for Improving Nitrogen Use Efficiency in Wheat, Corn, and Grain Sorghum by Using Active Sensors Leo Espinoza & DharmendraSaraswat 2012 Arkansas Crop Management Conference January 17, 2012
Presentation Outline Need Basics of Optical Sensing Operational Details 4. Local Experience Leo Espinoza & DharmendraSaraswat 2012 Arkansas Crop Management Conference January 17, 2012
Need 1. Price of Fertilizer 2. Environmental Concerns Leo Espinoza & DharmendraSaraswat 2012 Arkansas Crop Management Conference January 17, 2012
Sources for Hypoxia Agricultural sources > 70% N & P VS. Urban – 9 to 12% Source: Alexander et al., 2008 Leo Espinoza & DharmendraSaraswat 2012 Arkansas Crop Management Conference January 17, 2012
Where does Arkansas Stand? Source: Alexander et al., 2008 Leo Espinoza & DharmendraSaraswat 2012 Arkansas Crop Management Conference January 17, 2012
Remote Sensing- Opportunities Remote sensing - growth parameters and reflectance data* Source: http://rst.gsfc.nasa.gov/Intro/Part2_1x.html *Plant et al., 2000, Reddy et al., 2003; Zarco-Tejada et al. 2005 Leo Espinoza & DharmendraSaraswat 2012 Arkansas Crop Management Conference January 17, 2012
Plant Reflectance 0.5 Visible Near Infrared Indicator of Available Chlorophyl Reflectance (%) Measure of living plant cell’s ability to reflect infrared light 0.25 Photosynthetic Potential 0.00 450 500 550 600 650 700 750 800 850 900 950 1000 1050 Wavelength (nm) Source :http://nue.okstate.edu/ Leo Espinoza & DharmendraSaraswat 2012 Arkansas Crop Management Conference January 17, 2012
Soil and crop reflectance Source :http://nue.okstate.edu/ Leo Espinoza & DharmendraSaraswat 2012 Arkansas Crop Management Conference January 17, 2012
Normalized Difference Vegetation Index (NDVI) Based on ratios of Red and NIR Reflectance Red Reflectance: rred = Rred / Ired NIR Reflectance: rnir = Rred / Ired • Soil NDVI = -0.05 to .05 • Plant NDVI = 0.4 to 0.9 Source :http://nue.okstate.edu/ Leo Espinoza & DharmendraSaraswat 2012 Arkansas Crop Management Conference January 17, 2012
Normalized Difference Vegetative Index - NDVI • Calculated from the red and near-infrared bands • Equivalent to a plant physical examination • Correlated with: • Plant biomass • Crop yield • Plant nitrogen • Plant chlorophyll • Water stress • Plant diseases • Insect damage Source :http://nue.okstate.edu/ Leo Espinoza & DharmendraSaraswat 2012 Arkansas Crop Management Conference January 17, 2012
Active Sensors GreenSeeker Crop Circle Source :http://nue.okstate.edu/ Leo Espinoza & DharmendraSaraswat 2012 Arkansas Crop Management Conference January 17, 2012
Detection of Reflected NIR and RED Direction +Sun NIR and RED Modulated Illumination Target GreenSeekerTM Sensor Light Detection and Filtering Source :http://nue.okstate.edu/ Leo Espinoza & DharmendraSaraswat 2012 Arkansas Crop Management Conference January 17, 2012
Calculate NDVI ? Lookup valve setting ? Apply valve setting ? Send data to UI ? Sensor Function Light signal Valve settings Light Light Valves andNozzles detection generation “Sensor” Source :http://nue.okstate.edu/ Leo Espinoza & DharmendraSaraswat 2012 Arkansas Crop Management Conference January 17, 2012
Reference Strips Difference between: High N reference (best possible with more than adequate N) Low N reference (0 N applied) Operational Details- Components Source :http://nue.okstate.edu/ Leo Espinoza & DharmendraSaraswat 2012 Arkansas Crop Management Conference January 17, 2012
Operational Details- Components Reflectance measurements: V6, V&, V8, V9, V10 N- treatment: 0, 50, 100 ,150, 200, 250, 300, and 350 lbs N/acre Leo Espinoza & DharmendraSaraswat 2012 Arkansas Crop Management Conference January 17, 2012
Operational Details- Components Station: South East Research and Extension Center (SEREC), Rohwer Type: Hybrid 1 and Hybrid 2 Soil Type: Clay Soil Crop Rotation: Corn after Rice Leo Espinoza & DharmendraSaraswat 2012 Arkansas Crop Management Conference January 17, 2012
Operational Details- Components Station: South East Research and Extension Center (SEREC), Rohwer Type: Hybrid 1 and Hybrid 2 Soil Type: Clay Soil Crop Rotation: Corn after Soybean Leo Espinoza & DharmendraSaraswat 2012 Arkansas Crop Management Conference January 17, 2012
Summary of Approach-Example Leo Espinoza & DharmendraSaraswat 2012 Arkansas Crop Management Conference January 17, 2012
Potential Technology- APPA Leo Espinoza & DharmendraSaraswat 2012 Arkansas Crop Management Conference January 17, 2012
EXPERIENCES Leo Espinoza & DharmendraSaraswat 2012 Arkansas Crop Management Conference January 17, 2012
60 -80 lb/acre 80-110 lb/acre (Scharf, U of MO)
Grain Sorghum Test During 2011, a farmer planted grain sorghum and applied approx. 60 lb N/acre (32% UAN). He lost his crop and had to replant He assumed that he had lost all his N and applied approx. 100 lb N/a 40 days after replant to alternating 8 rows, with the other 8 rows receiving nitrogen according to GreenSeeker readings. A N-rich Strip was established by V3.
160 lb N/acre 60 lb N/acre
Grain Sorghum Test Yield 160 lb N/a = 102 bu/a 60 lb N/a = 98 bu/a
0.65 0.76 0.76 0.56 0.61 0.62 0.41 0.36 4 7.3 7.8 8.2 8.5 10.1 10.5 10.7 T/ha 0 25 50 75 100 125 150 175 Kg/ha
Wheat Test 2011 Applied 160 lb/a N Dec 2010 to 8 rows.
Wheat Test 2011 (NDVI Maps) Mid February Mid March 160 lb/a N
40 acres 2012 GreenSeeker Tests 1500 acres
Conclusions New Technologies for plant and soil sensing for producers to take a note of. Baseline conditions are required to be established each year. Further work is continuing to validate results
Acknowledgment Leo Espinoza & DharmendraSaraswat 2012 Arkansas Crop Management Conference January 17, 2012
THANKS FOR YOUR TIME QUESTIONS? Leo Espinoza & DharmendraSaraswat 2012 Arkansas Crop Management Conference January 17, 2012