Download
1 / 19
200 likes | 429 Views
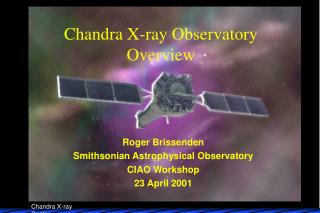
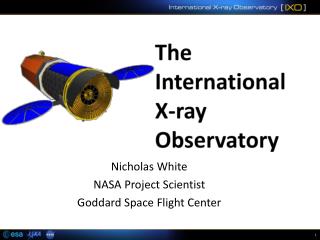
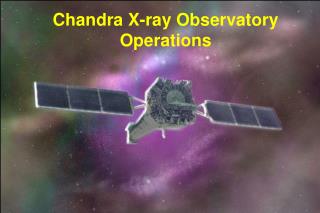
Chandra X-ray Observatory Operations. Overview. 1. Mission and Observatory Description 2. Chandra Operations 3. Chandra X-ray Center Architecture 4. Mission Metrics 5. Operational Process Example - Reacting to Radiation Belts. NASA’s Great Observatories. CHANDRA. Chandra Mission Summary.

E N D
Overview 1. Mission and Observatory Description 2. Chandra Operations 3. Chandra X-ray Center Architecture 4. Mission Metrics 5. Operational Process Example - Reacting to Radiation Belts
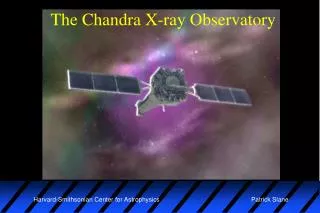
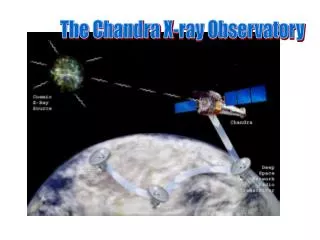
NASA’s Great Observatories CHANDRA
Chandra Mission Summary • Launch July 23, 1999 • STS-93/ Inertial Upper Stage / Integral Propulsion System • 10,000 km x 140,000 km, 28.4o Inclined Orbit • Design Lifetime > 5 Years • 10-m Focal Length Wolter -1 Mirror: 4 nested Mirror Pairs • Energy Range: 0.1-10 KeV • 2 Imaging Focal Plane Science Instruments • ACIS (Advanced CCD Imaging Spectrometer) • HRC (High Resolution Camera) • 2 Objective Transmission Gratings for Dispersive Spectroscopy • LETG (Low-Energy Transmission Grating) • HETG (High-Energy Transmission Grating)
Advanced CCD Imaging Spectrometer (ACIS) CCD array with 16’x16’ field of view (ACIS-I) high energy grating readout array (ACIS-S) High Resolution Camera (HRC) microchannel plate imager with 31’x31’ field of view (HRC-I) low energy grating readout array (HRC-S) High Energy Transmission Grating Spectrometer (HETG) transmission grating pairs for medium and high energy Low Energy Transmission Grating Spectrometer (LETG) transmission grating for low energy ACIS-I ACIS-S HRC-I HRC-S Chandra Science Instruments
Chandra Launch • Launched on Space Shuttle Columbia 7/23/99 on the third attempt • Shuttle placed Chandra and IUS in 150 mile orbit • Chandra was the longest and heaviest payload launched on the Shuttle • Payload bay doors open 1.5 hours after launch • Chandra/IUS deployed 7.5 hours after launch
Chandra Deployment and Orbit • Inertial Upper Stage (IUS) boosted Chandra from shuttle orbit to transfer orbit. Two stage rocket with two 2 minute burns. • Chandra separated from the IUS 9.5 hr into mission with orbit of 300km x 74,000km • Chandra’s Integral Propulsion System fired 5 times over 15 days to reach final orbit: 10,000 km x 140,000 km. Orbit of 64 hrs and going 1/3 of way to moon
ssssssssssssssssssssss CXO CXC OCC 2. Chandra Operations • Mission science plan converted to command loads and uplinked to Chandra • X-ray events collected and stored on Solid-State Recorders (SSR) • Ground contact established every ~8 hours through Deep Space Network • SSR data downlinked • new command load uplinked (up to 72 hours of stored commands) • Data transferred to OCC through JPL for science processing
Chandra Telemetry Commands Telemetry (Via Shuttle) Commands Telemetry Deep Space Network Telemetry Commands Deep Space Network Commands DSN Scheduling State Vector OCC Off-Line System On-Line System S/C Support & Data Capture Eng Analysis Observation Request Mission Schedules Attitude Det. & Telemetry Telemetry Sensor Cal Processing Mission Planning Command Ops CXC & Scheduling Processing Simulator Command Operations Communication Proposed Observation Management Database Science Data IPIs, Guest Observers S/W Changes Flight S/W Maint Fac
Data processed through levels Level 0 - De-commutates telemetry & processes ancillary data Level 1 - Event processing Level 2 - Source detection and derived source props Level 3 - Catalogs spanning multiple observations AP System comprised of series of pipelines controlled through registry and Observation Status Tracker Pipeline defined by ASCII profile containing a list of tools and parameters specified at run-time Pipeline profile executed by Pipeline Controller Profiles and Controller are configurable and support conditional execution of tools branching and converging of threads CXC Pipeline Processing
4. Mission Metrics Cycle 1 Observing Efficiency (Nov. 1 1999 - August 15, 2000)
Chandra Archive • Chandra telemetry rate 32 KB/s results in ~120 Gby/yr telemetry • Expansion from telemetry to processed products ~10:1 • Archive ~650 Gby after 14 months with ~2:1 compression • Growth rate of ~500 Gb/yr or ~1 Tby/yr uncompressed • Average of 25 Gby/month retrieved; range of 6-60 Gby
5. Operational Processes: Example • Degradation in the ACIS energy resolution of front side chips detected as increase in Charge Transfer Inefficiency in September 1999. Backside chips (S1 and S3) unaffected. • Degradation due to low energy protons (~100 keV) focussed by mirror during radiation belt passage • Halted by moving ACIS out of focal plane during radiation belt passage • Effect can be offset by reduced focal plane temperature and via ACIS flight software changes, e.g., “squeegee mode” under development • Multiple operational impacts required systems approach to respond efficiently
Implications and Response • Operational implications • Modified mission scheduling to ensure ACIS safed for belt passages & added CTI measurements: efficiency impact • Spacecraft software changes to protect Instruments in the event of spacecraft safing action • Modified ACIS, ground operations and science processing software • Modified observing program for optimal chip usage • Developed new calibration program • Real-time alerts from • solar monitoring data & models • Single anomaly resulted in system-wide changes and response • Include system case in ops design