Storm Mobilization Decisions: A Decision-Analytic Approach
280 likes | 365 Views
Explore the challenges and strategies of early storm mobilization in emergency management. Learn how decision tools can aid in improving response times and resource allocation before and after a storm hits.

Storm Mobilization Decisions: A Decision-Analytic Approach
E N D
Presentation Transcript
“Pulling the Trigger” on Storm Mobilization A decision-analytic approach to Emergency Management Discussion document Presented at the Infocast Conference on Emergency Preparedness and Service Restoration for Utilities New Orleans, Louisiana March 28, 2007
Agenda • The problem in a nutshell • A decision-analytic approach • Observations and Key Questions 1
Early mobilization is the key to timely storm restoration… With early prediction you can: • Identify needed resources • Get them called out and rolling • In time to travel to the area • And be there when the trouble starts • To get the feeders back up quickly • Restoring the most customers early • So you can find the taps that are out • And get working on the single no-lights • And communicate more accurately • To give advanced notice and initial ERTs • To customers, media, and governments • To instill confidence and show leadership “If only I could have known I needed that many crews, I would have got them there right from the start” 2
…But ‘pulling the trigger’ can be difficult… Barriers to mobilization include: • Mobilization is expensive • Overtime for your own crews • Costs for contractors and foreign crews • Logistics costs (reservations, meals, etc. ) • Mutual assistance is not automatic • Other companies want you to be sure • ‘False alarms’ cause future problems • All companies in the area may have needs • Inadequate information causes indecision • Will the weather really be bad? • Will the damage be as bad as the weather? • Will we have resources standing idle? Uncertainty and inadequate information cause indecision and poor storm response Before the storm, there is not enough information. After the storm, there is no shortage of second-guessers 3
…So, better decision tools are needed Historical relationships Uncertainties Decision tools Better decision tools are needed and available: • Weather models and measures • Utility-oriented forecast models • Ensemble forecasts for risk assessment • More detailed grid measurements • Storm mobilization models • Relate weather to damages/outages • Relate damage to resource requirements • Relate resource requirement, availability and effectiveness to initial and ongoing Estimated Restoration Times (ERTs) Weather Weather forecasts & assessments Damage prediction & assessment Damage and outages Resource requirement prediction & tracking Resource requirements, availability & effectiveness Time to complete restoration Restoration Time Estimator With better decision tools, emergency managers can more effectively ‘pull the trigger’ to make and communicate mobilization decisions 4
Agenda • The problem in a nutshell • A decision-analytic approach • Observations and Key Questions 5
Decision models can help both before and after the storm has hit Before the storm During the storm Weather prediction Weather assessment Prediction models facilitate storm mobilization before the storm • Forecasters predict weather • Weather drives outages • Outages drive damage • Damage drives resources • Resources affect restoration time Similar tools help manage work and ERT’s during the storm • OMS and patrollers provide actual outages and damage • Resource model uses actual outage and damage data to estimate resources • Actual resources available versus resources needed drives estimated ERTs Outage prediction model Outage and damage assessment Damage prediction model Resource requirement model Planned resources Actual resources Planned Restoration Time Estimated Restoration Time With a better way to predict the resources needed, valuable time early in the storm can be saved, reaping shorter overall restoration 6
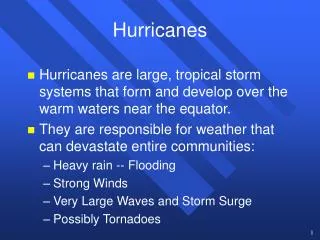
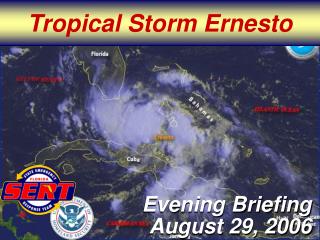
Most bad weather can be somewhat predicted Outage-causing bad weather comes in various forms, all of which are at least partly predictable: • Hurricanes are visible days in advance, but their exact path is uncertain • Sustained high winds tend to be an areawide phenomenon, forecastable in advance, but ‘micro-bursts’ and tornadoes are unpredictable in force and location • Storm fronts, and their associated lightning, wind, and rain or snow, are forecastable, but can vary in force and location • Ice storms are generally anticipated, but the exact accumulation and location vary • Heat waves are forecastable within the week but the impact on utilities depends on wind, cloud cover, humidity, and demand response Even though some aspects of weather are unpredictable, many weather events are very predictable and allow no excuse for not mobilizing 7
Developing relationships to outages begins with historical weather • Historical weather data is available online from NOAA: • Daily data for each month (the F6 report) can be found for local offices by clicking on the national map at: www.weather.gov/climate/index.php • The locations with the most data are airports, e.g., • Chicago-O’Hare (ORD) • South Bend (SBN) • Charleston, WV (CRW) • The data include: • Temperature (Hi-Lo-Average) • Wind speed and direction • Precipitation • NOT lightning strokes New sources of historical weather data can be even more detailed in terms of time, place, and type of weather 8
NWS Storm Event records can supplement F6 data • Event Record Details • Event: Tstm Wind State: West VirginiaBegin Date: 10 Jul 2003, 04:44:00 PM EST County: Kanawha • Begin Location: Yeager Arpt (CRW) • Begin LAT/LON: 38°22'N / 81°36'W • End Date: 10 Jul 2003, 04:44:00 PM EST • End Location: Yeager Arpt (CRW) • End LAT/LON: 38°22'N / 81°36'W • Magnitude: 50 • Fatalities: 0 • Injuries: 0 • Property Damage: $ 0.0 • Crop Damage: $ 0.0 • Description:A potent squall line developed during the early afternoon across central Ohio, on southwest to central Kentucky. This was along a prefrontal surface boundary, and well out ahead of a strong cold front. The atmosphere warmed into the 80s with surface dew points in the 70 to 75 degree range. Additional thunderstorms formed into a broken west to east line across West Virginia, ahead of the squall line. This caused flooding problems. After 1500E, the squall line accelerated eastward, moving near 50 mph. As a result of this event, a few more counties, such as Ritchie and Harrison, were added to FEMA's disaster declaration number 1474. This federal disaster was initiated during the month of June. The National Weather Service has a special service as part of NOAA’s NCDC (National Climatic Data Center). It produces an entry for all storm events, and can be searched by state, county, and date range. Typical data includes the wind speed for ‘Tstm (Thunderstorm) Wind’ events, property damage, and text describing such things as ‘trees down’, ‘power lines down’, etc. 9
Lightning stroke data are available from the NLDN May 17, 2004: Strokes hitting ComEd territory: 11,300 May 18, 2004: Strokes hitting PECO territory: 737 • Lightning stroke data are available from the National Lightning Detection Network in Tucson, AZ • Many companies have been using lightning stroke data for years • Data can be integrated with territory maps to get accurate counts of strokes by region • The maps shown are of Northern Illinois and Eastern Pennsylvania (Exelon territory). 10
Sustained wind speed tends to be a regional phenomenon Sustained wind speed differences of more than 5 mph normally span 100’s of miles 75 miles 800 miles 11
Gusts (5-sec) are closely related to sustained wind (2-min) 12
Mountainous areas are less predictable than level plains Although Huntington is only 50 mi W of CRW and Beckley is only 50 mi SE of CRW, on the windiest days the sustained wind can differ by as much as 10-25 mph Because of the terrain around Charleston and Southern WV, the usual similarity of sustained wind at nearby locations is not as valid. As a result, the model needed to use data from three locations: Charleston, Huntington, and Beckley 13
Significant terrain features can complicate weather patterns • The terrain of AEP’s Appalachian Power Co. in WV is quite different than other locations in AEP (and many other companies) • Wind does not just ‘blow over’ the plains and hills as it would elsewhere, but is blocked and channeled by the mountains and valleys, creating very localized weather • Also, rain falls in abundance as clouds hit the mountains, creating flash floods as a major cause of outages 14
Lightning strokes drive lightning outages City A City B .0029 .0065 City D City C .027 .0046 The relationship is linear in the number of strokes, with slopes that are similar but vary with equipment density per square mile 15
How to translate NWS lightning language into strokes for the model This table can be used to input a stroke forecast into the model: NWS languageStrokes per region to enter into the model City ACity BCity CCity D None 0 0 0 0 Occasional 1,000 500 1,000 1,000 Frequent 10,000 1,000 10,000 4,000 Continuous 20,000 2,000 20,000 8,000 When this is done, the model will use its assumptions about outages/stroke for each region to produce a forecast of lightning-caused outages as follows (note that the coefficients are about double those for the lightning-only outages, reflecting the other outages and even non-outage calls that tend to be related to events with heavy lightning): Outages/strokes .0065 .035 .009 .009 Projected Outages: Frequent 150 35 90 36 Continuous 300 70 180 72 Lightning can usually be forecast, at least in order of magnitude, and that can help mobilize the right amount of resources for a storm. 16
Wind-caused outages are exponentially related to wind speed City A • There is an exponential relationship between wind speed and wind-caused outages, e.g., • The step from 40 to 50 mph causes much more damage than from 20 to 30 mph • The relationship is significantly affected by three other variables: • There is a seasonal affect due to the loss of leaves on deciduous trees from November to March • The duration of the wind matters, starting with emphasizing 2-min sustained wind speed over 5-sec gusts, • And also how many days the high-wind conditions prevail Notes: Outages are adjusted for lightning-caused outages, leaving only wind-caused and other. Ice storms are also excluded for this part of the analysis. ‘Equivalent wind’ adjusts the wind speed for seasonal effects and for extra duration, e.g., in winter, an actual wind speed of 35 mph is adjusted to an effective wind speed of about 31 mph, which produces half as many outages. Also, in storms in which more than one day had high winds, the effective wind speed is increased accordingly. The non-linearity of the wind relationship, as well as the factors for seasonality and duration, are part of why utilities cannot rely solely on storm managers’ intuition and experience. They need a model. 17
Similar relationships hold for different locations City A City B City D City C 18
A storm mobilization model starts with the weather input… Illustrative North South West Central As a storm approaches, forecasts can be entered into the model to drive the likely number of outages, amount of damage, and need for resources 19
…then calculates outages, damages, and person-hours needed… Based on the weather (and the historically-derived model parameters), the model estimates: • Outages – by type • Damages – by type of outage, since different damage types drive different resource requirements, e.g., wire-down-type outage that requires repair, versus a blown fuse • Resources required to achieve a desired CAIDI (or you can work it the other way – tell it the resources you have and it will tell you what the restoration time will be) North South West Central North South West Central North South West Central 20
…to determine resources required or to predict restoration time Model is used to determine resources needed for a given CAIDI: • With the forecast of resources required, the storm manager can consider the model’s recommendation as an aid to his/her own judgment • For a given amount of resources, the model can provide an informed early estimate of the time required to restore service • As actual outages and damage assessments become known, they can be fed into the model for new estimates of resource requirements and expected restoration time North South West Central Or to predict CAIDI based on a given set of resources available: North South West Central The model is a tool to be used to enhance judgment, notreplace it. It aids intuition and helps make the decision to ‘pull the trigger’ or not 21
Although the pace of restoration is proportional to outages… • The number of outages restored is generally proportional to the time elapsed, since it often takes the same amount of time to restore a feeder as to restore a small tap • By contrast, Customers Interrupted are restored in a non-linear fashion, because crews are dispatched first to outages that have a large number of customers interrupted Note: This data is from City A’s 2003 storms, and, in percentage terms, is representative of the proportionality exhibited in other locations as well. The total time elapsed is the time required to restore 95% of the outages, since the definition of the ‘end’ of the storm can be confused with a regular day’s outages otherwise. Halfway through the restoration, only half the outages are restored, depending on whether the company got a good start, etc. 22
…The restoration of customers interrupted is non-linear in time Halfway through the restoration, much greater than 50 percent of customers are restored, because of prioritization of restoration 23
The model has been tested by ‘backcasting’ actual storms City A 2003 Storms Notes: Wind in mph, sustained. Lightning in total strokes. The model will not be as accurate as you would like, but using a model like this allows you to get better with each storm 24
A mobilization model can benefit from continuous improvement • Each new storm offers an opportunity to see how well the model fits, and to explore model enhancements and parameter changes if it does not • Typical enhancements might include: • More detailed weather data • More non-linearities and special factors • Like effect of rain-soaked soil • Measuring the effect of changes in restoration methods and practices • Better data collection on damages incurred, resources used, etc. • Like scientists, we advance best by “standing on the shoulders of others” Rachel Spicer standing on the shoulders of P. Barry Tomlinson in Miami, Florida at the Harvard Summer Workshop in Tropical Botany While storm managers will also benefit from practice, using a model like this will allow them to learn more and to pass it on to others 25
Agenda • The problem in a nutshell • A decision-analytic approach • Observations and Key Questions 26
Observations and Key Questions Observations • Surprisingly, most companies do not have very much sophistication in their decision support tools for storm mobilization – reliance on experience and judgment is typical • All the evidence in decision-making processes shows that better decisions are made when supported by sound, user-friendly tools that enhance judgment without replacing it • With a flexible tool, each application can give rise to lessons learned that enhance the capability of both the tool and the users Key Questions • Could you make better decisions on storm mobilization with a mobilization model? • What would it take to put something like this in practice in your utility? Questions? Dan O’Neill President and Managing Consultant O’Neill Management Consulting, LLC 404-816-5647 danoneill@oneill managementconsulting.com Doing the same thing over and over again does not lead to improvement. Measuring your decisions against a model allows learning and growth 27