Download
1 / 41
420 likes | 562 Views
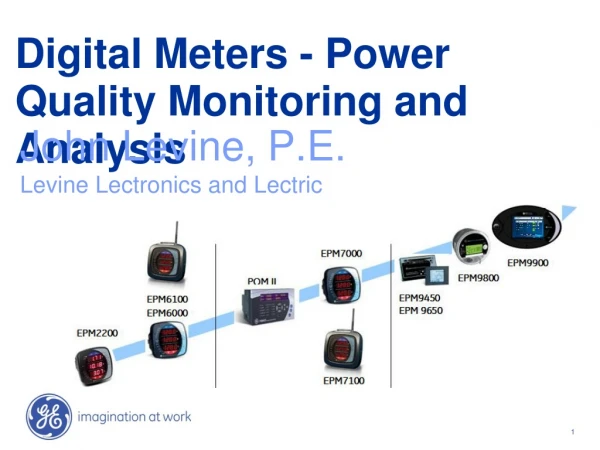
Digital Meters - Power Quality Monitoring and Analysis. Bala Vinayagam Mar 21, 2006. Contents. Effects of power quality Power Quality definitions revisited What is needed for PQ monitoring ? GE Multilin’s solution PQMII EPM9000 series Summary.

E N D
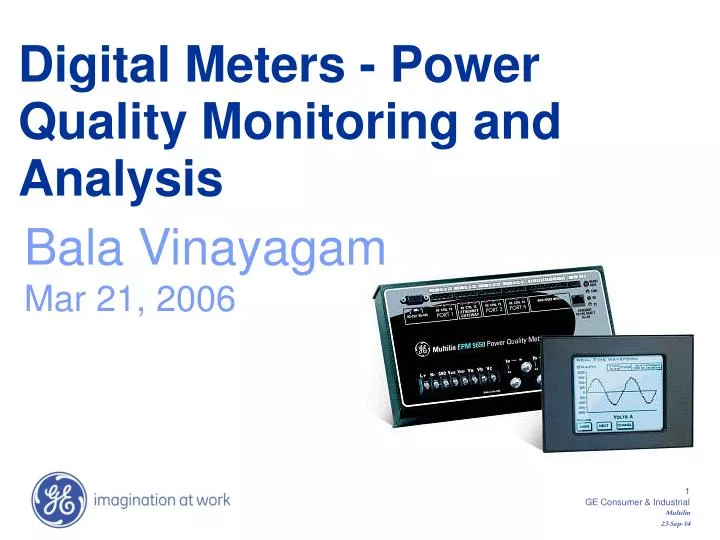
Digital Meters - Power Quality Monitoring and Analysis Bala Vinayagam Mar 21, 2006
Contents • Effects of power quality • Power Quality definitions revisited • What is needed for PQ monitoring ? • GE Multilin’s solution • PQMII • EPM9000 series • Summary Monitor and Analyze Power Disturbances, Disruptions & Harmonics
PQ is a Business Problem • Power Quality issues cause business problems such as: • Lost productivity, idle people and equipment • Lost orders, good will, customers and profits • Lost transactions and orders not being processed • Revenue and accounting problems • Customer and/or management dissatisfaction • Overtime required to make up for lost work time According to Electric Light and Power Magazine, 30 to 40 Percent of All Business Downtime Is Related to Power Quality Problems.
Why PQ is such a Big Problem? • The sensitivity of today’s electronic equipment makes it susceptible to power disturbances • For some devices, a momentary disturbance can cause • scrambled data • interrupted communications • a frozen mouse • system crashes and equipment failure
PQ Problems are Expensive • Berkeley Lab Study Estimates $80 Billion Annual Cost of Power Interruptions … Research News, Berkeley Lab, February 2, 2005 • $50 billon per year in the USA is lost as a results of power quality breakdowns …. Bank of America Report • A manufacturing company lost more than $3 million one day last summer in Silicon Valley when the “lights went out.” … New York Times January 2000 • “A voltage sag in a paper mill can waste a whole day of production - $250,000 loss” … Business Week, June 17,, 1996 • Half of all computer problems and one-third of all data loss can be traced back to the power line … Contingency Planning Research, LAN Times
Who is Affected? • High Cost Facilities • Semiconductor plants • Pharmaceuticals • Data centers • Lost production • Scrap • Costs to restart • Labor costs • Equipment damage and repair • Other costs • MediumCost Facilities • Automotive manufacturing • Glass plants • Plastics & Chemicals • Textiles
PQ Definitions Revisited For Electric Utilities Control of Voltage and Prevention of Outages is Power Quality
Sources of PQ Problems • Internal Sources • Individual Loads –Lighting, Elevators, Coolers, HVAC • Uninterruptible Power Supplies • Variable Frequency Drives • Battery Chargers • Large Motors During Startup • Electronic Dimming Systems • Lighting Ballasts (esp. Electronic) • Arc Welders, and Other Arc Devices • Medical Equipment, e.g. MRIs and X-Ray Machines • Office Equipment and Computers • Wiring • Utility Sources • Lightning • PF Correction Equipment • Faults • Switching
Outages, 6% Spikes, 7% Swells, Sags, 56% 31% Source: EPRI, 1994 Major PQ Problems Swells System fault conditions Switching on a large capacitor bank Switching off a large load Sags (Dips) Associated with system faults Switching of heavy loads Starting of large motors
Textile Industry Plastics Industry Glass Industry Process Industry Semiconductors $1k $10k $100k $1M $10M Source: EPRI “The Economics of Custom Power”, IEEE T&D Show 2003 Losses per Voltage Sag Event Cost of Voltage Sags
Momentary Outages create problems when computers and clocks reset, equipment stalls, and work stops. Cost of Momentary Outages
High Speed Waveform Capture High Speed Waveform Capture Is the Most Important PQ Troubleshooting Tool
It provides data to see, diagnose and avert looming problems – “like squeaky brakes on a car” • Trends can be detected • JIT equipment maintenance programs can be established • It acts like a “Black Box” on an airplane to tell you what, when, and where a Power Quality event occurred … to prevent it from reoccurring Benefits of Continuous PQ Monitoring • Power Quality monitoring provides a continuous “Health Check” of a facility’s power system … for example: • Harmonic interaction between loads and power conditioning equipment spotted • High Inrush currents from equipment startup detected • Transients from load switching are seen ContinuousPQ Monitoring Detects, Records, and Leads to the Prevention of PQ Problems
What is needed for PQ Monitoring? • Plus they must … • Be easy to use • Be Suitable for continuously monitoring indoors and outdoors • Interface with standard PQ analysis Software…PQDif format • Be fast enough to capture high speed events that produce equipment problems • Have enough storage to save the waveforms you need • Have PQ analysis tools that produce usable, actionable recommendations • PQ Monitors must detect and record the 7 types of PQ problems • Transients • Interruptions • Sag/Under Voltage • Swell/Over Voltage • Waveform Distortion • Voltage Fluctuations • Frequency Variations • These include Flicker and Compliance to ITI(CBEMA), IEEE and ISO Standards ITI: Information Technology Industry Council (Computer & Business Equipment Manufacturer’s Association)
Power & Power Quality Metering System • High Range PQ • Transients Flicker • High Sampling Rate • Utility Hardened • Web Server • Ladder Logic I/O • EPM 9000 / 9800 • Up to 512 samples / cycle • Web server • .02 accuracy • Flicker and transients recording • Mid Range PQ • Waveform • Events/Alarms • Data Logging • I/Os • PQM II • Power Quality parameters • Data logging • Control options • Basic Metering • 50+ Parameters • 0.3% Accuracy • I/Os • THD, F, PF….. EPM 6000 0.2 revenue class accuracy New Additions: THD and KYZ pulse option EPM 2000 Low cost – panel mount Single P/N PL2000 • EPM 1000 / EPM 4000 • Wall/Panel mountable enclosure • Power line carrier capability • Modbus communication • Multi-Point monitoring capability • Energy Aggregator support • Sub Metering • Tenant Metering • 10-20 Parameters • .5 % Accuracy Sub Meter Basic Metering Mid Range PQ High Range PQ Basic PQ Monitoring to Advanced PQ Monitoring, Detection & Analysis 26
GE Power Quality Meters • High End PQ Meters • Power professionals world-wide rely on GE’s products for their power monitoring and communication applications. • GE’s meters provide high speed waveform capture, advanced power quality, multiport communications and control. PQMII EPM9450/9650 EPM9800
Power Quality Meter – PQM II • All basic electrical parameters • Data logging and waveform • Voltage disturbance analyzer • Analog outputs, digital inputs • Control relays and KYZ pulses • Multiple communication ports • Easy to program and set-up… EnerVista • Replaces multiple analog meters
Key Features High accuracy, mid range Power Quality with many advanced features. Waveform capture using set-points for PQ analysis. Waveform can be triggered by external equipment (motors) through digital inputs for capturing start-up current etc…. Control Relays can open and close at the pre-programmed (min, max etc) set-points for alarms and notifications. Analog outputs for power information to PLCs, RTU and other non digital communication devices. VERY EASY to use , program and set-up – comes with free set-up and monitoring software (launch pad). Voltage Disturbance Recording for electrical up to 500 sag & swell events Open Modbus and DNP 3.0 protocol over RS 485 with multi port communication capability Target Applications/Industries Ideal for circuit monitoring for control panels, switchboards, Motor Control Centers, Power Distribution Panels. Primary Monitoring of low and medium voltage application, requiring full metering with over 100 different electrical parameters with data logging and oscillograph (waveform). Applications requiring Control Relays with set-point activation, Analog and digital I/Os. Heavy power users for need of clean power - Data Centers, Pulp and Paper, Oil & Gas……. OEMs, Electrical Panel Manufacturers, Switchgear manufacturers, Motor Control manufacturers….. Power Quality Meter – PQM II Power Quality with Advanced Voltage Disturbance Recorder
Advanced PQ Meter – EPM 9000/9800 • Advance Power Quality with Revenue Metering • Highest Grade Revenue Accuracy - 0.06% Energy • Advanced Waveform Recording and Analysis – 512 samples /cycle • Built Ethernet 100 Base T – Total Web Solutions • Advanced Control for Load Shedding and Demand Control
Key Features: High Speed Waveform Recording - With up to 16 to 512 samples per cycle resolution. The unit records magnitude and duration of events including the captured waveform. All information is stored in the on-board mass memory. Software and Hardware Triggers - The meters provides both software and hardware triggers to record waveform events. This allows the unit to be used for fault analysis, system apparatus monitoring and many other applications. Extensive Harmonics Analysis – This meter provides a real- time harmonic analysis to the 128th order for every channel. This advanced harmonic recording capability has been traditionally available only in high-end power quality recorders. Records THD to the 255th order peak. Real Time Phasor Analyzer - The unit monitors phase angles between the voltage and the currents. Web Server Capability – Data from meters is viewable over the web. Data from the ModBus devices connected to the meter can also be viewed. Expandable I/O Modules for Analysis and Control Target Applications/Industries: Primary Monitoring of low medium and high voltage application, requiring full metering, with data logging, controls and high speed oscillography (waveform). Remote monitoring over the web using web pages Applications requiring Control Relays with set-point activation, Analog and digital I/Os. Heavy power users for need of clean power - Data Centers, Microprocessor Chip Manufacturers Pulp and Paper, Oil & Gas……. OEMs, Electrical Panel Manufacturers, Switchgear manufacturers, Motor Control manufacturers….. Advanced PQ Meter – EPM 9000/9800 Advance PQ Analysis with Revenue Class Accuracy
Key Features: High Speed Waveform Recording - With up to 16 to 512 samples per cycle resolution. The unit records magnitude and duration of events including the captured waveform. All information is stored in the on-board mass memory. Software and Hardware Triggers - The meters provides both software and hardware triggers to record waveform events. This allows the unit to be used for fault analysis, system apparatus monitoring and many other applications. Extensive Harmonics Analysis – This meter provides a real- time harmonic analysis to the 128th order for every channel. This advanced harmonic recording capability has been traditionally available only in high-end power quality recorders. Records THD to the 255th order peak. Real Time Phasor Analyzer - The unit monitors phase angles between the voltage and the currents. Web Server Capability – Data from meters is viewable over the web. Data from the ModBus devices connected to the meter can also be viewed. Expandable I/O Modules for Analysis and Control Target Applications/Industries: Primary Monitoring of low medium and high voltage application, requiring full metering, with data logging, controls and high speed oscillography (waveform). Remote monitoring over the web using web pages Applications requiring Control Relays with set-point activation, Analog and digital I/Os. Heavy power users for need of clean power - Data Centers, Microprocessor Chip Manufacturers Pulp and Paper, Oil & Gas……. OEMs, Electrical Panel Manufacturers, Switchgear manufacturers, Motor Control manufacturers….. Advanced PQ Meter – EPM 9000/9800 Advance PQ Analysis with Revenue Class Accuracy
Real Time Field Recorded Events Source: AGA Brazil Meter: EPM9650 Period: Jan 2005 – Dec 2005 Continuous Monitoring of the Station for PQ Problems
PQ Meter ITI Capture ITI Acceptable Power Disturbance Envelope Damage Inducing Voltage Surges as Recorded Equipment Interrupting Voltage Sags as Recorded ITI: Information Technology Industry Council (Computer & Business Equipment Manufacturer’s Association)
Accurate Measurement to determine actual state Examinations High resolution recordings for longer durations GE Communicator software Diagnosis Remedial actions Remedy Summary • GE Multilin provides the necessary tools for a successful PQ disturbance analysis and allows users to take remedial actions Symptoms Feels the pulse of the power system network
Finally… If You Can’t Measure it You Can’t Manage it If You Can Measure it You Can Manage it