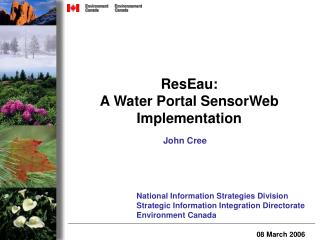
Flood Sensorweb
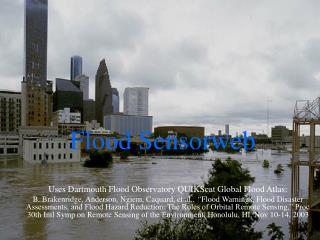
Flood Sensorweb. Uses Dartmouth Flood Observatory QUIKScat Global Flood Atlas:

Flood Sensorweb
E N D
Presentation Transcript
Flood Sensorweb Uses Dartmouth Flood Observatory QUIKScat Global Flood Atlas: B. Brakenridge, Anderson, Ngiem, Caquard, et al., “Flood Warnings, Flood Disaster Assessments, and Flood Hazard Reduction: The Roles of Orbital Remote Sensing,” Proc 30th Intl Symp on Remote Sensing of the Environment, Honolulu, HI, Nov 10-14, 2003
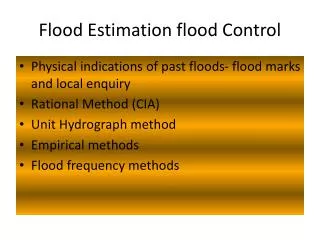
Floods - Detection Dartmouth-Flood Observatory QuikSCAT • The DFO in collaboration with JPL/QuikSCAT processes QuikSCAT Scatterometer data to assess surface water conditions. • VV/HH ratio is used to assess surface water properties of the areas in 0.25 lat/lon degree bins • The 7 day running mean is used to dampen effects of short-duration rainfall over urban areas. • This data is then compared to the seasonal (90 day) average of the previous year to screen out wetlands. POC: Brakenridge/DFO Ngiem/JPL
Flood alerts are then used to retask EO-1. EO-1 Hyperion Image Brahmaputra Aug 6, 2003 MODIS Image Brahmaputra, India Aug 6, 2003 250M resolution (10M ALI Pan band possible) 30M resolution
Impact Higher resolution data is acquired of: • key locations (pre-determined satellite gauging reaches) and • times (active flooding regions) With the end result of improved flood science.
Status - Floods • September, October 2003 - Several demonstrations performed to track flooding in the Brahmaputra River basin, India • December 2003 – continued demonstrations to track Yellow River, China
Volcano Sensorweb Uses University of Hawaii, Hawaii Institute for Geophysics & Planetology detectors: Harris, A. et al., (2002) Web-Based Hot Spot Monitoring using GOES: What it is and How it Works,Advances in Environmental Monitoring and Modelling http://www.kcl.ac.uk/advances Vol. 1 No. 3 (2002) pp.5-36 Wright, R., Flynn, LP, Garbeil, H, Harris, AJL, and Pilger, E. (2002). Automated volcanic eruption detection using MODIS.Remote Sensing of Environment, 82, 135-155. Flynn, LP, Wright, R, Garbeil, H, Harris, AJL, and Pilger, E. (2002). A global thermal alert using MODIS: initial results from 2000-2001.Advances in Environmental Monitoring and Modeling, 1, 5-36.
Volcano Sensorweb Earth Observer One Re-tasking GOES, MODIS, AVHRR Triggers
Status - Volcanoes • Demonstrations in progress using MODVOLC • Recent triggers of • Kilauea, HI; • Belinda, Antarctica • SGM /GOES & AVHRR linkup in progress • End impact is • larger archive of active volcano remote sensing imagery • Increased imagery of early phenomena imagery