Download
1 / 47
470 likes | 597 Views
This presentation discusses the complexities of constructing effective software fault prediction models, particularly when faced with varying amounts of fault data. It addresses issues such as predicting faults without any data, limited fault information, and the presence of noise in measurement datasets. Tools and techniques such as logistic regression, decision trees, and neural networks will be explored along with the differentiation between fault prediction in cross-company versus within-company scenarios. The goal is to enhance the reliability, security, and availability of software systems through effective predictive modeling approaches.

E N D
Real-World Challenges in Building Accurate Software Fault Prediction Models DR. ÇAĞATAY ÇATAL TUBITAK (Research Council of TURKEY) Predictive Modelling and Search Based Software Engineering, London, UK, 24-25 October 2011
Outline • Introduction • Dependable Software Systems • Motivation • Challenging Issues • Fault prediction with no fault data • Fault prediction with limited fault data • Noise detection on measurement datasets • Practical tools (Eclipse plug-in) • Cross company vs. Within-company fault prediction • Our Models • A Systematic Review Study • Conclusion
Dependable Systems • Are we successful in building dependable software systems? • Safety (not being harmful for environment) • Security (ability to protect the privacy) • Reliability (ability to perform its function for a period of time) • Availability (ability to serve whenever needed)
1. BRITISH ATM PAYS DOUBLE ! 19 March 2008 Hull, England • ATM pays out double the amount withdrawn • Dozens of customers lined up in front of ATM • This continued until ATM ran out of money at 8 p.m.
A Generous British ATM... A Sainsburry’s spokesman said “ We do not know how much the machine paid out at the moment but the matter is under investigation” A customer said “ I joined the queue and when I finally got to the front I drew out 200 pound but it gave me 400 pound. The statement said I only drew out 200 pound. I don’t know whether I will have to pay it back” The police said “ Those who benefited could face charges, but only if the company administering the machine complained”.
But what happens if an ATM malfunctions and pays out less than you asked for? We need dependable systems !
Motivation • Project Managers ask several questions: • “How can I get the code into production faster? • What code should we refactor? • How should I best assign my limited resources to different projects? • How do I know if code is getting better or worse as time goes on?” “Baseline Code Analysis UsingMcCabe IQ” • Software Metrics • Software Fault Prediction
Example: gcc project • /trunk/gcc/fold-const.c • http://gcc.gnu.org/viewcvs/trunk/gcc/fold-const.c?revision=135517&view=markup • fold_binary’s CC value is 1159 ! • Security problems or faults can occur
Vulnerability Report – Fold_Binary Method http://vulnerabilities.aspcode.net/14389/fold+binary+in+fold+const+c+in+GNU+Compiler+Col.aspx
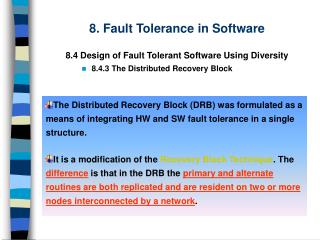
Software Fault Prediction Modeling Current Project Previous Version Predict Faults Software Metrics Unknown Fault Data Software Metrics Known Fault Data Training Learnt Hypothesis
1. No Fault Data Software Metrics Software Metrics Unknown Fault Data Learnt Hypothesis Training Predict Faults Previous Version Unknown Fault Data Current Project • * How does the software quality assurance team predict the software quality based on only the recorded software metrics? • - A new project type for organization • - No quality measurement have not been collected • * Supervised learning approach cannot be taken
2. Limited Fault Data Known Fault Data Software Metrics Training Software Metrics Unknown Fault Data Learnt Hypothesis Predict Faults Previous Version Unknown Fault Data Current Project * During decentralized software development, some companies may not collect fault data for their components * Execution cost of data collection tools may be expensive * Company may not collect fault data for a version due to the lack of budget - Can we learn both from labeled and unlabeled data?
3. Noise Detection • Noisy modules degrades the performance of machine learning based fault prediction models • Attribute Noise • Class Noise • Class noise impact classifiers more severely as compared to attribute noise • We need to identify noisy modules if they exist Some cases: • Developers may not report the faults • Data entry and data collection errors
4. Practical Tools • Earliest Work, Porter and Selby, 1990 • .... • Logistic Regression (Khoshgoftaar et al., 1999) • Decision Trees (Gokhale et al., 1997) • Neural Networks (Khoshgoftaar et al., 1995) • Fuzzy Logic (Xu, 2001) • Genetic Programming (Evett et al., 1998) • Case-Based Reasoning (Khoshgoftaar et al.,1997) • Pareto Classification (Ebert, 1996) • Discriminant Analysis (Ohlsson et al., 1998) • Naive Bayes (Menzies et al., 2008) • ... Hundreds of research papers but lacking of practical tools…
5. Cross-Project vs. Within-Company Fault Prediction Can we use cross-company (CC) data and predict the fault-proneness of program modules in the absence of fault labels?
1. No Fault Data Problem- Literature • Zhong et al., 2004, Clustering and Expert based Approach • K-means and Neural Gas algorithms • Mean vector and several statistical data such as min., max. • Dependent on the capability of the expert • Zhong, S., T. M. Khoshgoftaar, and N. Seliya, “Unsupervised Learning for Expert-based Software Quality Estimation”, Proceedings of the 8th Intl. Symp. on High Assurance Systems Engineering, Tampa, FL, 2004, pp. 149-155.
1. No Fault Data Problem 1.Our technique first applies X-means clustering method to cluster modules and identifies the best cluster number. 2. The mean vector of each cluster is checked against the metrics thresholds vector. A cluster is predicted as fault-prone if at least one metric of the mean vector is higher than the threshold value of that metric. [LOC, CC, UOp, UOpnd, TOp, TOpnd] [65, 10, 25, 40, 125, 70] (Integrated Software Metrics (ISM) document)
Datasets from Turkish white-goods manufacturer • Effective results are achieved • No expert opinion • Identification of threshold vector is difficult
2. Limited Fault Data Problem • We simulated small labeled-large unlabeled data problem with 5%, 10%, and 20% rates and evaluated the performance of each classifier under these circumstances. • Naive Bayes algorithm, even if it is a supervised learning approach, works best for small datasets • YATSI (Yet Another Two Stage Idea) improves the performance of Naive Bayes algorithm for large datasets if the dataset does not consist of noisy modules • We suggest Naive Bayes for limited fault data problem as well
3. Noise Detection Our hypothesis: • A data object that has a non-faulty class label is considered a noisy instance if the majority of the software metric values exceed their corresponding threshold values. • A data object that has a faulty class label is considered a noisy instance if all of the metric values are below their corresponding threshold values. • How to calculate software metrics threshold values? R. Shatnawi, W. Li, J. Swain, T. Newman, Finding software metrics threshold values using ROC curves, Journal of Software Maintenance and Evolution:Research and Practice 22 (1) (2010) 1–16.
How to Calculate Threshold Values • The interval for the candidate threshold values is between the minimum and maximum value of that metric in the dataset. • Shatnawi et al. (2010) stated that they chose the candidate threshold value that hasthe maximum value for both sensitivity and specificity, but such a candidate threshold may not always exist. • We calculated the AUC of the ROC curve that passes through three points, i.e., (0, 0), (1, 1), and (PD,PF), and we chose the threshold value that maximizes the AUC.
5. Cross-Project Fault Prediction • We developed models based on software metrics threshold values • If majority of software metrics thresholds values are exceeded, the label of the module is faulty • Otherwise, non-faulty label is assigned • Threshold values are calculated from the other projects (cross-company)
Results Case studies showed that the use of cross-company data is useful for building fault predictors in the absence of fault labels and remarkable results are achieved. Our threshold-based fault prediction technique achieved larger PD (but larger PF) value than Naive Bayes based approach. For mission critical applications, PD values are more important than PF values because all of the faults should be removed before deployment. In summary, we showed that cross-company dataset is useful.
A Systematic Review Study • 74 papers published between 1990 and 2007 • 27 journal papers • 47 conference papers • We report distributions before and after 2005, since that was the year that thePROMISE repository was established.
Results The journals that published more than two fault model papersare: IEEE Transaction of Software Engineering (9); Software Quality Journal (4); Journal of Systems and Software (3); Empirical Software Engineering (3) 14% of papers were published before 2000 and 86% after. Types of data sets used by authors were: private (60%), partial(8%), public (31%), unknown (1%). ‘‘Partial” means data fromopen source projects that have not been circulated. Since 2005the proportion of private datasets has reduced to 31%, the proportionof public data sets has increased to 52%. There are 14%partial datasets and 3% unknown.
Results (cont’d) Data analysis methods are machine learning (59%), statistics(22%), statistics and machine learning (18%) and statistics andexpert opinion (1%). After 2005 the distribution of methods ismachine learning (66%), statistics (14%), statistics and machinelearning (17%) and statistics and expert opinion (3%). 60% of papers used method level metrics, 24% used class levelmetrics, 10% were file level metrics, other categories less than5%. 2005, 53% were method level, 24% were class level and17% were file level (others less than 3%).
Suggestions More studies should use class-level metrics to support early prediction. Fault studies should use public datasets to ensure results can berepeatable and verifiable. Researchers should increase usage of machine learning techniques.
Conclusion & Future Work • Software fault prediction is still challenging and quite useful • We need practical tools • Prediction models can be used to predict vulnerability-prone modules • Challenges • How to make fault prediction work across projects ? • How to build models when there is no fault data? • How to build models when there is very limited fault data? • How to remove noisy modules from datasets?
THANK YOU Cagatay CATAL, Ph.D. cagatay.catal@bte.tubitak.gov.tr www.cagataycatal.com