Download
1 / 1
10 likes | 120 Views
Understand the impact of summer precipitation changes on regional hydrology, agriculture, and economy in the fast-growing Southeast USA. Discover shifts in precipitation extremes between 1948–2004.

E N D
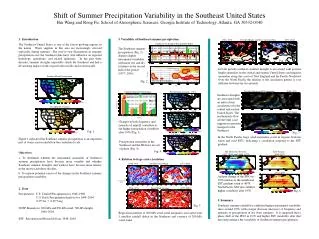
Shift of Summer Precipitation Variability in the Southeast United States Hui Wang and Rong Fu, School of Atmospheric Sciences, Georgia Institute of Technology, Atlanta, GA 30332-0340 1. Introduction The Southeast United States is one of the fastest growing regions in the nation. Water supplies in this area are increasingly stressed especially during summer. The year-to-year fluctuations in summer precipitation over the Southeast thus have vital influence on regional hydrology, agriculture, and related industries. In the past three decades, summer droughts repeatedly struck the Southeast and had a devastating impact on this region both socially and economically. 3. Variability of Southeast summer precipitation 1948–1975 500-hPa Height and Wave Activity Flux 1977–2004 Southeast US Summer Precipitation Index The Southeast summer precipitation (Fig. 2) displays higher interannual variability with more wet and dry extremes in the second half of the period (1977–2004). 5% significance level Fig. 6 Variance: 30% 70% 1976 8 6 4 2 0 In both periods southeast summer drought is associated with positive height anomalies in the central and eastern United States and negative anomalies along the coasts of New England and the Pacific Northwest. Over the North Pacific the relation to the circulation pattern is very different between the two periods. 5% significance level Period (yr) Summer Mean Precipitation Fig. 2 Wavelet Power Spectra Year 850-hPa Wind and SST Anomalies 1948–1975 Summer Rainrate Distribution Precipitation Anomaly 1993 Southeast droughts are associated with an anticyclonic circulation over the central and eastern United States. The northeasterly flow off the Gulf coast suppresses moisture transport to the Southeast. 5 driest summers (1948-1975) 5 wettest summers (1948-1975) 5 driest summers (1977-2004) 5 wettest summers (1977-2004) 1948-2004 long-term mean Fig. 3 mm/day % of summer days Precipitation Variance Precipitation Anomaly 2000 1977–2004 No rain 0.1 – 1 1 – 10 > 10 mm/day Rainrate Changes in both frequency and intensity of rainfall contribute to the higher precipitation variability after 1976 (Fig. 3). Fig. 1 mm/day Fig. 7 mm2/day2 r( US Precip, SE Precip Index) In the North Pacific large wind anomalies occur in regions between warm and cold SSTs, indicating a circulation response to the SST gradient. Figure 1 indicates that Southeast summer precipitation is an important part of warm season rainfall on the continental scale. Precipitation anomalies in the Southeast and the Midwest are out of phase (Fig. 4). Fig. 4 SST Difference between (1977–2004) and (1948–1975) SST Variance 1948–1975 Objectives a. To determine whether the interannual anomalies of Southeast summer precipitation have become more variable and whether Southeast summer droughts and wetness have become more intense in the most recent three decades. b. To explore potential causes of the changes in the Southeast summer precipitation variability. 4. Relation to large-scale circulation 1948–1975 200-hPa Zonal Wind 1977–2004 1977–2004 K A phase change of the PDO in 1976 reinforces the meridional SST gradient south of 40oN. North Pacific SST also exhibits higher variability after 1976. 5% significance level 2. Data Precipitation: U.S. Unified Precipitation for 1948–1998 U.S. Daily Precipitation Analysis for 1999–2004 0.25o lat × 0.25o long NCEP Reanalysis: 200-hPa and 850-hPa wind, 500-hPa height 1948–2004 SST: Reconstructed Reynolds Data, 1948–2004 1948–1975 Zonal Wind Variance 1977–2004 Fig. 8 K2 5. Summary Southeast summer rainfall has exhibited higher interannual variability since around 1976, with a larger decrease (increase) of frequency and intensity of precipitation in dry (wet) summers. It is suggested that a phase shift of the PDO in 1976 and higher SST variability after that may help enhance the variability of Southeast summer precipitation. Fig. 5 Regression patterns of 200-hPa zonal wind anomalies associated with 1 mm/day rainfall deficit in the Southeast and variance of 200-hPa zonal wind.