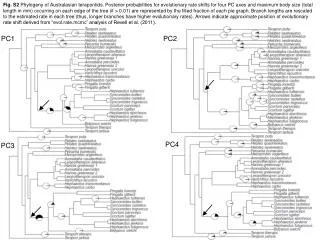
Evolutionary Rate Shifts in Australasian Terapontids: Phylogenetic Insights and Body Size Correlations
This study explores the phylogeny of Australasian terapontids, highlighting posterior probabilities for evolutionary rate shifts across four principal component axes and maximum body size (total length in mm). Each pie graph visually represents the fractions of evolutionary rates on each tree edge, with larger branches indicating higher rates. The analysis also indicates the positions of evolutionary rate shifts based on Revell et al.'s 2011 "evol rate mcmc" method. This work contributes to a deeper understanding of evolutionary dynamics within this group.

Evolutionary Rate Shifts in Australasian Terapontids: Phylogenetic Insights and Body Size Correlations
E N D
Presentation Transcript
Fig. S2 Phylogeny of Australasian terapontids. Posterior probabilities for evolutionary rate shifts for four PC axes and maximum body size (total length in mm) occurring on each edge of the tree (if > 0.01) are represented by the filled fraction of each pie graph. Branch lengths are rescaled to the estimated rate in each tree (thus, longer branches have higher evolutionary rates). Arrows indicate approximate position of evolutionary rate shift derived from “evol.rate.mcmc” analysis of Revell et al. (2011). PC1 PC2 PC4 PC3